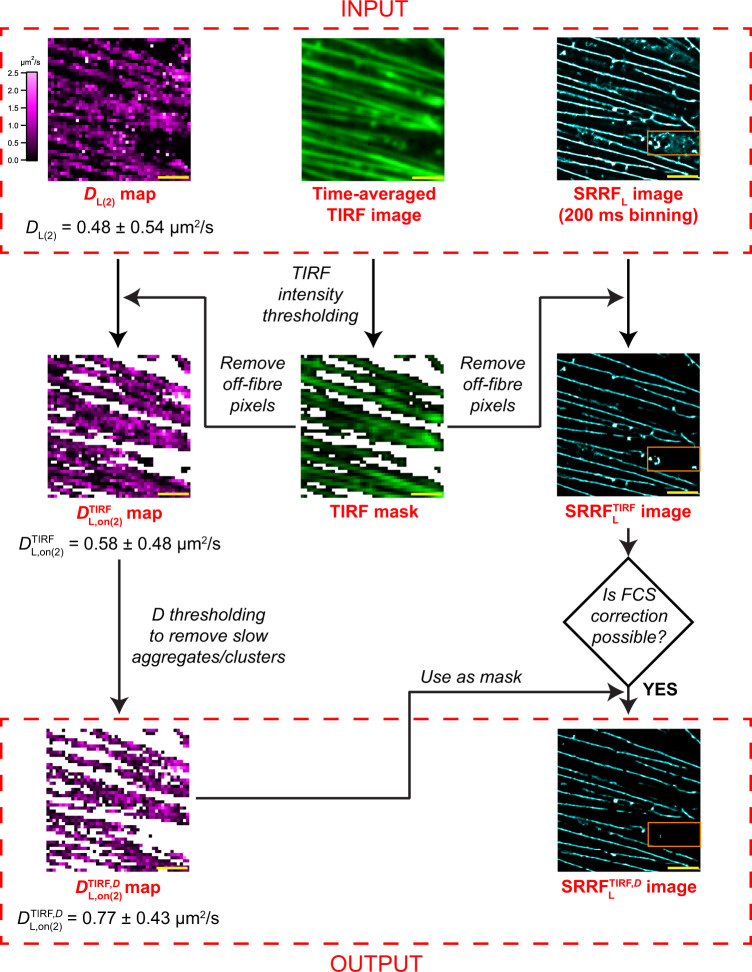
Fig. 3. Schematic outlining the strategy to improve the accuracy and precision of the D map, and its further use to correct the SRRF image.
The untreated DL(2) map, TIRF image and SRRF image of a CHO-K1 cell expressing Lifeact-EGFP serve as the starting files. First, we create an intensity filtered TIRF mask which is then applied to the DL(2) map and SRRF image to remove the contributions from off-fibre artefacts generating the and images respectively. The map is then filtered by thresholding D values to remove the slow clusters. The resulting map is used as a mask to remove artefacts from the image to generate the image. For the dual-colour measurements, the Lifeact SRRF image is filtered only by using the TIRF image as a mask. The orange box indicates an area that contained artefacts in the original SRRFL image and are now removed in the image.

