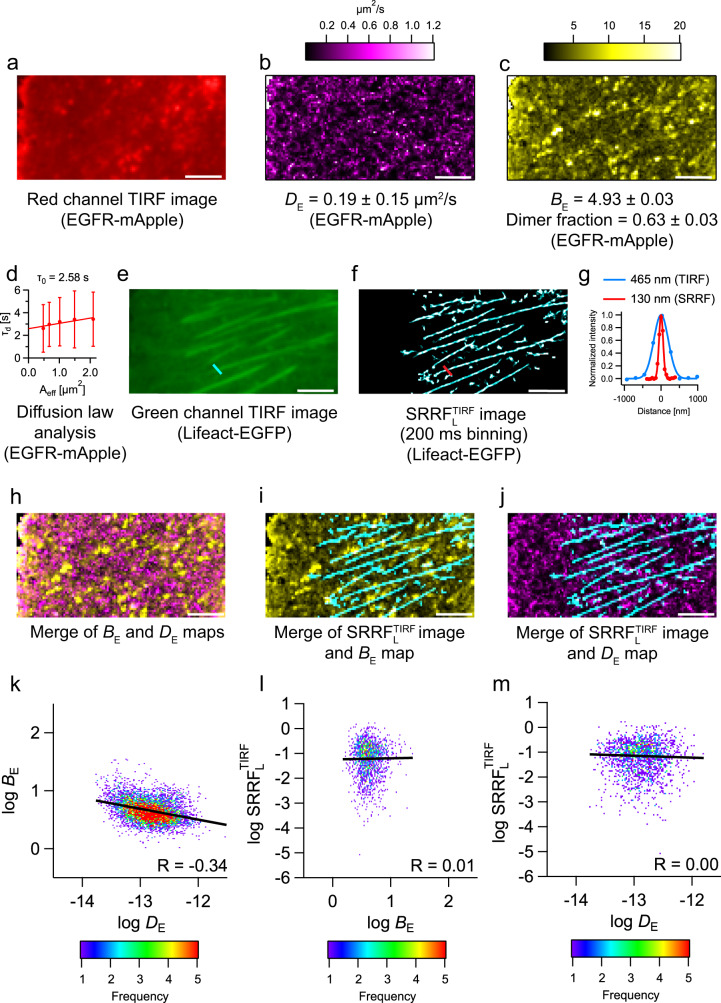
Fig. 4. Multi-parametric analysis from a single dual-channel fluorescence data set.
a TIRF image of EGFR-mApple. b Diffusion map of EGFR-mApple (DE = 0.19 ± 0.15 µm2/s). c Brightness map of EGFR-mApple (BE = 4.93 ± 0.03, dimer fraction-me = 0.63 ± 0.03; mean ± SEM). d Diffusion law analysis of EGFR-mApple (refer Supplementary Fig. 16 for more details); intercept = 2.58 s; values are mean ± SD (n = 6384 pixels at 1 × 1 binning). e TIRF image of Lifeact-EGFP. f image (200 ms binning) of Lifeact-EGFP. g Normalized intensity profile across an actin fibre before and after SRRF microscopy. Thickness (FWHM of the Gaussian fit) of the actin fibre before SRRF (blue line in (e)) = 465 nm. The thickness of the actin fibre after SRRF (red line in (f)) = 130 nm. h Merge of BE and DE maps of EGFR-mApple. The BE pixels are coloured yellow, and the DE pixels are coloured magenta. Correlated pixels between the two maps are coloured white. i Merge of (Lifeact-EGFP) and BE (EGFR-mApple) maps. pixels are coloured cyan, and BE pixels are coloured yellow. Correlated pixels between the two maps are coloured white. The SRRF image was spatially binned to the same dimensions as the B map. j Merge of (Lifeact-EGFP) and DE (EGFR-mApple) maps of EGFR-mApple. pixels are coloured cyan, and DE pixels are coloured magenta. Correlated pixels between the two maps are coloured white. The SRRF image was spatially binned to the same dimensions as the D map. k 2D frequency plot of log BE vs log DE values from image (h). l 2D frequency plot of log vs log BE values from image (i). m 2D frequency plot of log vs log DE values from image (j). The scale bars in white measure 5 µm in images (a)–(e), (h)–(j). This figure uses cell 1 in Table 1. The reported values are averages obtained from analysis of an entire cell. The analyses were performed on six cells from three different batches of cells with similar results (Table 1). Source data is available as a Source data file.

