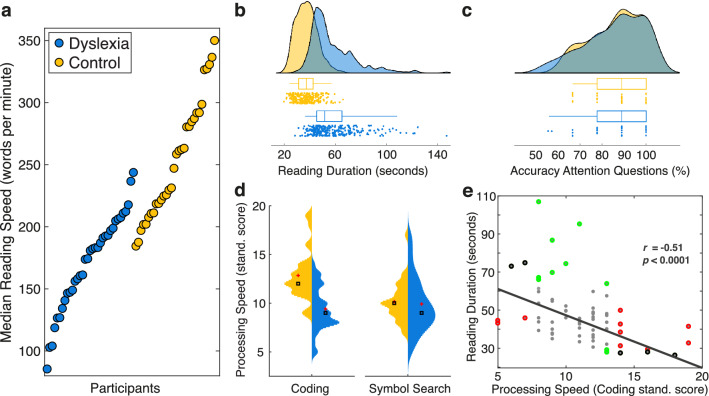
Figure 2.
Behavioral results. (a) Caterpillar plot of median reading speed (words per minute) per participant sorted in ascending order. Blue dots represent participants of the dyslexia group whereas yellow dots represent participants of the control group. (b) Single-trial reading duration in seconds by group. Groups are color-coded as in (a). (c) Attention to the texts as a measure of reading comprehension. Color notation as in (a). (d) Cognitive processing speed from the WAIS-IV scale74 by group. Higher scores illustrate faster processing speed. The left-hand side (i.e., yellow/light color) of each violin plot depicts scores of the control group; the right-hand side (i.e., blue/dark color) depicts scores of the dyslexia group. Red crosses denote group means, black squares group medians. (e) Correlation between reading duration (seconds) and standardized coding processing speed scores across all participants. The shown correlation coefficient (r) and p-value resulted from a robust bend correlation analysis (n = 67). Colors indicate down-weighted data points: red for data in X, green for data in Y and black for data in X and Y dimensions. In each dimension, 20% of the data points were down-weighted. This figure is best viewed in color.

