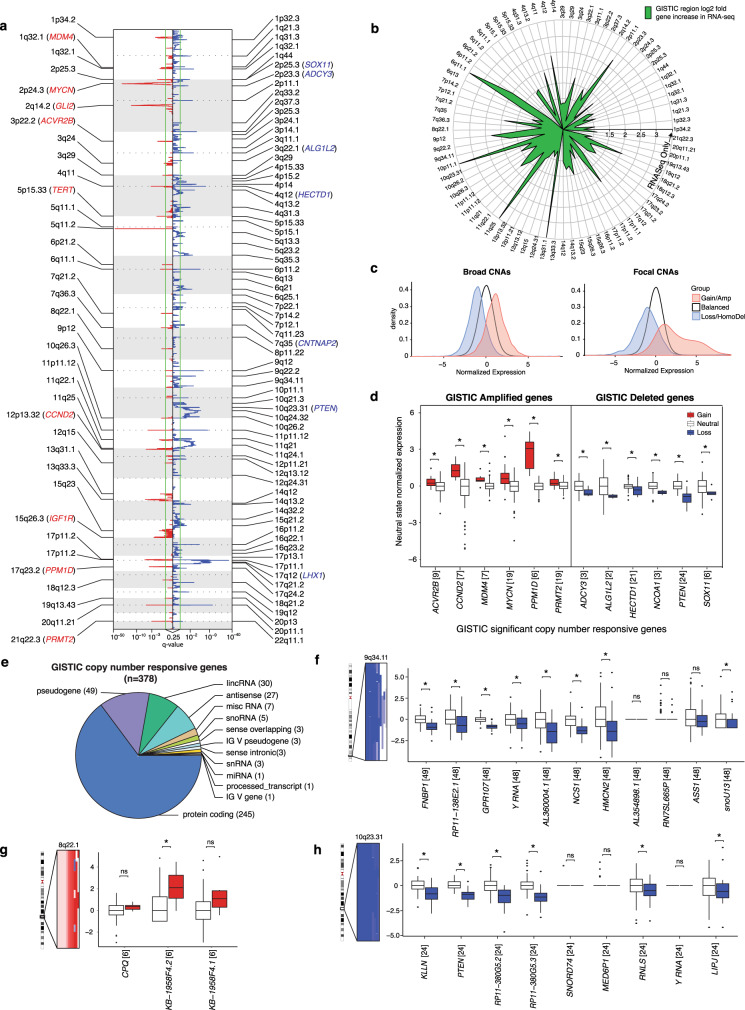
Fig. 4. Somatic copy number aberrations in Shh-MB.
a GISTIC significant amplifications (red) and deletions (blue) observed in Shh-MB (n = 126). b Log2 fold increase of known annotated gene in GISTIC regions using RNA-seq compared to expression arrays. GISTIC regions with genes only found in the RNA-seq dataset have points on the outermost circle. c Normalized expression density across broad and focal CNAs. d Expression difference between copy number neutral and aberrant states in GISTIC region copy number responsive genes. Each gene was normalized by its neutral copy number state distribution. Numbers in square brackets denote the number of patients detected with the CNA. The lower and upper hinges in the boxplot correspond to the first and third quartiles while the center line represents the median. The upper and lower whisker extends from the nearest hinge to the smallest/largest value at most 1.5 times the interquartile range. Points outside this range are outliers and are plotted individually. e GISTIC copy number responsive gene types. f–h Expression difference between copy number neutral and aberrant states in (f) 9q34.11, (g) 8q22.1, and (h) 10q23.31. Asterisks annotate significant copy number responsive genes (FDR < 0.05) calculated using a Kruskal-Wallis rank-sum test. Please refer to Supplementary Data 5 for exact P-values. The SNP 6.0 copy number segments are shown to the left of each graph. The expression of each gene was normalized by the expression median of the neutral copy number state.

