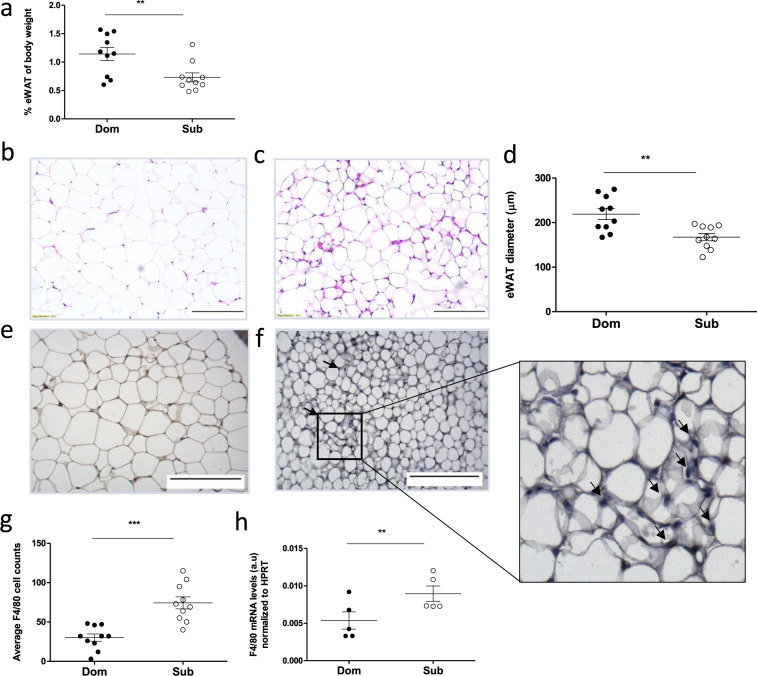
Fig. 2. Sub mice show lower eWAT mass, smaller adipocytes, and increased macrophage infiltration, as compared with Dom mice.
a Quantification of eWATs obtained from naive Dom and Sub mice (n = 10 in each group), normalized to the body weight of the respective mouse. Dom mice exhibit higher epididymis adipose mass. b, c Microscopic visualization of histological staining (×40 magnification, scale bar = 250 μm) of eWAT removed from Dom (b) and Sub (c) mice. d Quantification of adipocyte diameter of Dom and Sub mice determined from histological images using the ImageJ software. eWAT cells from 10 random cells per field were analyzed from 10 random fields in each mouse (SD of the diameter = 6.447 and 4.853 μm for Dom and Sub mice, respectively). The morphological differences of adipose tissue in the two groups of mice can be seen. e–g Macrophage infiltration was assessed by using immunohistochemistry (×40 magnification) for F4/80 in Dom (e) and Sub (f) mice (n = 10 each), and it was quantified g from histological images by using the ImageJ software. Ten random cells per field were analyzed from 10 random fields in each mouse. Arrows in f indicate crown-like structures of macrophages between adipocytes. h Macrophage quantification using F4/80 mRNA gene expression, normalized to HPRT, showing an increase in macrophage expression in Sub mice. a.u: arbitrary units. Statistical significance was assessed using Student’s t test. **p < 0.01, ***p < 0.001. Error bars show standard deviation.

