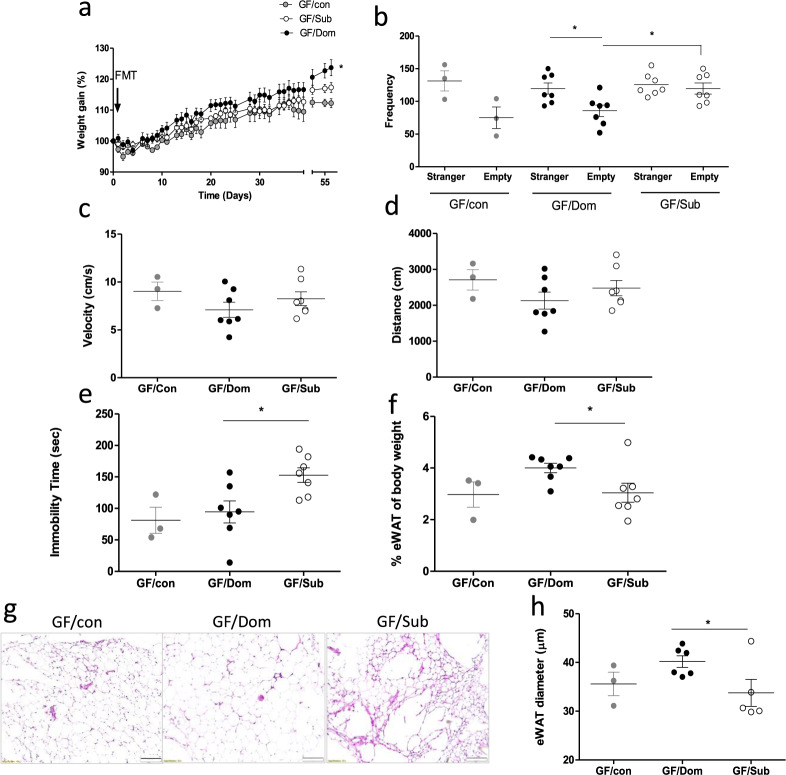
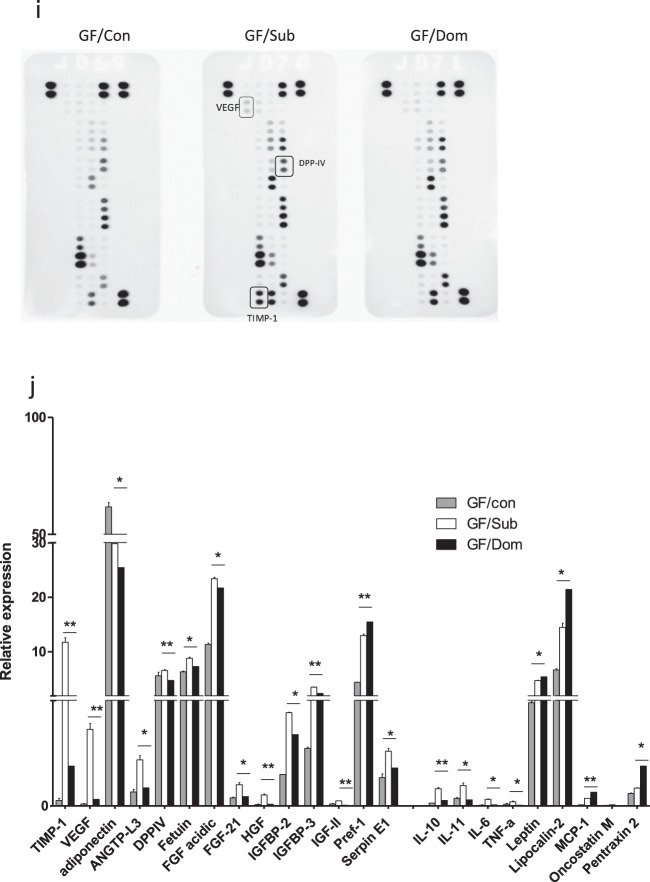
Fig. 6. The effects of FMT on mouse body weight, behavior, eWAT content, and adipokine profile.
a Body weight follow-up of transplanted GF mice. The curves represent the average mouse weight gain as a percentage from their weight at the day of transplantation. b–d Mouse social behavior, measured in the TCST. c, d The average velocity (c) and distance (d) per group shows similar locomotor activity in all the groups. e Depressive-like behavior, reflected in immobility time in the FST, in GF/Sub mice, as compared with normal behavior in GF/Dom mice. f Quantification of eWAT mass, obtained from GF mice, normalized to the respective body weight of each mouse. g Histological (H&E) staining of eWAT from GF-transplanted mice (×40 magnification, scale bar = 20 μm). h The eWAT cell diameter of transplanted GF mice was determined using the ImageJ software. Ten random cells per field were analyzed from 10 random fields in each mouse. i An adipokine array comparison of pooled proteins extracted from the eWAT of GF/Sub (n = 4) and GF/Dom (n = 4). j The eWAT adipokines that their expression was significantly altered following FMT. Each bar represents the average of duplicate adipokine expression normalized to the positive control. GF/Sub mice demonstrated a significantly higher adipokine level than GF/Dom mice. Statistical significance was determined using Student’s t test or one-/two-way ANOVA with Bonferroni correction, *p < 0.05, **p < 0.01. Error bars show standard deviation.


