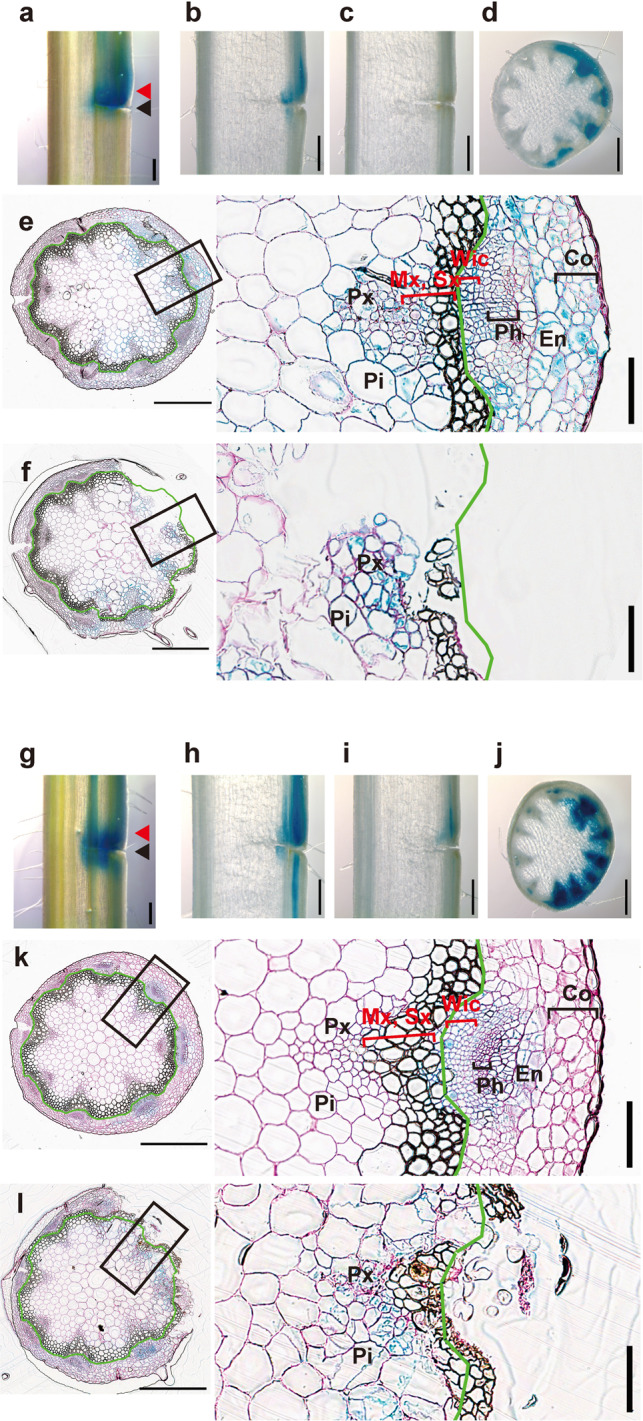
Fig. 3. Tissue localization of ANAC gene expression in incised stems.

Histochemical analysis of pANAC071::GUS (a–f) and pANAC096::GUS (g–l) was performed at 3 DAI. Opposite and incised sides are shown on the left and right, respectively. a, g Incised stems are displayed from the surface. Freehand longisections were prepared from incised stems with (b, h) or without (c, i) apical buds. d, j Freehand cross-sections from the incision to the upper part. Thin cross-sections were prepared from the upper region of the incision (e, k; red arrowheads of a and g) and the incised region (f and l; black arrowheads of a and g). Scale bars = 500 μm. Magnified images of the black rectangular area are shown on the right. The green line shows the outline of sclerenchyma tissue. Pi pith, Px protoxylem, Mx metaxylem, Sx secondary xylem, Wic wound-induced cambium, Ph phloem, En endodermis, Co cortex. Cell walls with red color were counterstained by periodic acid-Schiff. Scale bars = 100 μm.
