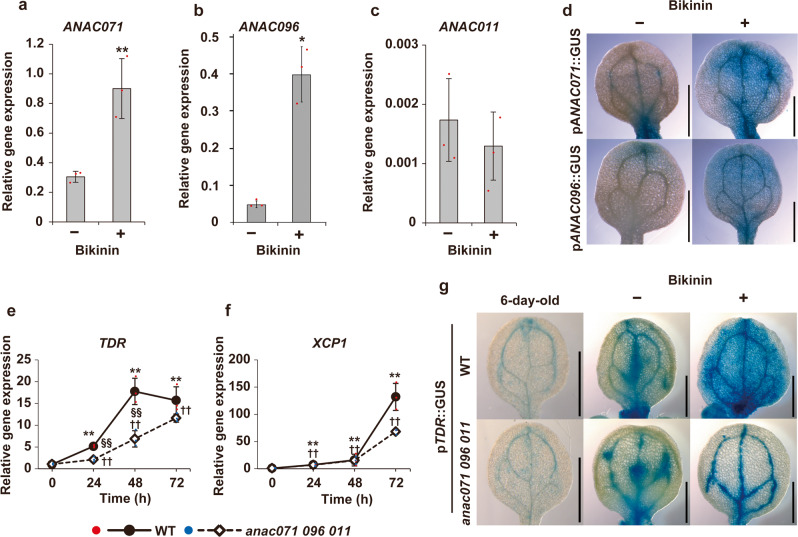
Fig. 6. Gene expression of ANAC and TDR/PXY under VISUAL assay.
a–c ANAC071 (a), ANAC096 (b), and ANAC011 (c) gene expression with (+) or without (−) bikinin treatment. Above-ground parts of WT were cultured under normal growth conditions for 2 DOC and used for RNA extraction. Statistical analysis was performed using Welch’s test (*P < 0.05. ** P < 0.01). d Histochemical GUS staining of pANAC071::GUS (top) and pANAC096::GUS (bottom). Cotyledons were observed at 4 DOC. Scale bars = 1 mm. e, f TDR/PXY and XCP1 expression was examined in the WT (close circles) and the anac071 096 011 triple mutant (open diamonds) at 0, 24, 48, and 72 h of culture. Relative gene expression was calculated when WT 0 h was set to 1. Asterisks or daggers indicate statistically significant differences from 0 h in the WT or anac mutant, respectively (** (††) P < 0.01; Tukey’s test). Red section signs indicate significant differences between WT and anac mutants. g Histochemical GUS staining from pTDR/PXY::GUS in WT and anac071 096 011 triple mutant background. Cotyledons were displayed in 6-day-old plants and at 4 DOC with or without bikinin. Scale bars = 1 mm.

