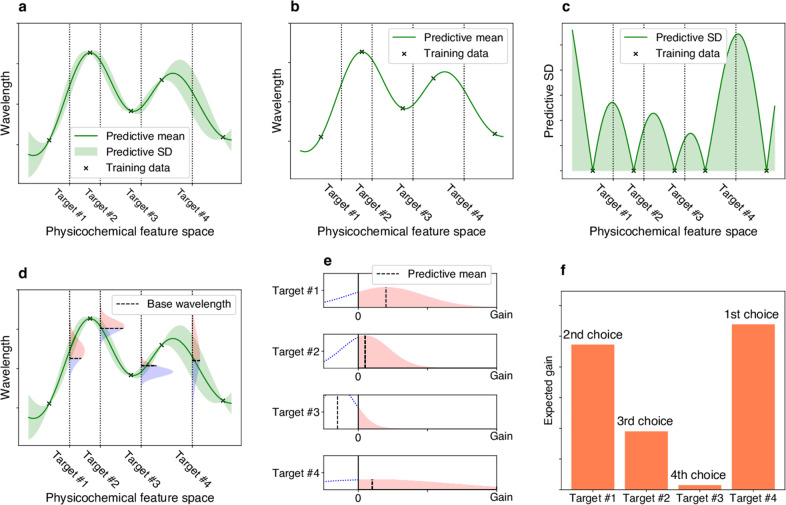
Fig. 2. Illustrations of exploration–exploitation for screening rhodopsins with red-shift gain.
a Bayesian prediction model constructed using the current training data (black crosses). The prediction model is represented by the predictive mean and predictive standard deviation (SD). The horizontal axis schematically illustrates the space of proteins defined through physicochemical features. The four vertical dotted lines indicate target proteins (candidates to synthesize). b Predictive mean. This function is defined as the expected value of the probabilistic prediction by the Bayesian model. c Predictive SD. Since the predictive SD represents the uncertainty of the prediction, it has a larger value when the training data points do not exist nearby. d The distributions on the vertical dotted lines represent the predictive distributions, and the horizontal dashed lines are the base wavelengths of the target points. The base wavelength is different for each target point because it depends on the subfamily of the protein. e The density of the predictive distribution of each target protein on its red-shift gain value. The gain is defined as the predicted wavelength subtracted by the base wavelength, and if it is negative, the value is truncated as 0. This can be seen as a “benefit” that can be obtained by observing the target protein. f Expected value of the red-shift gain. This provides a ranking list from which the next candidates to be experimentally investigated can be determined. Target #4 has the largest expected gain, although target #1 has the largest increase in the predictive mean compared with base wavelength in e. Because of its larger SD (as shown in a, c, d, and e), target #4 is probabilistically expected to have a larger gain than the other targets.

