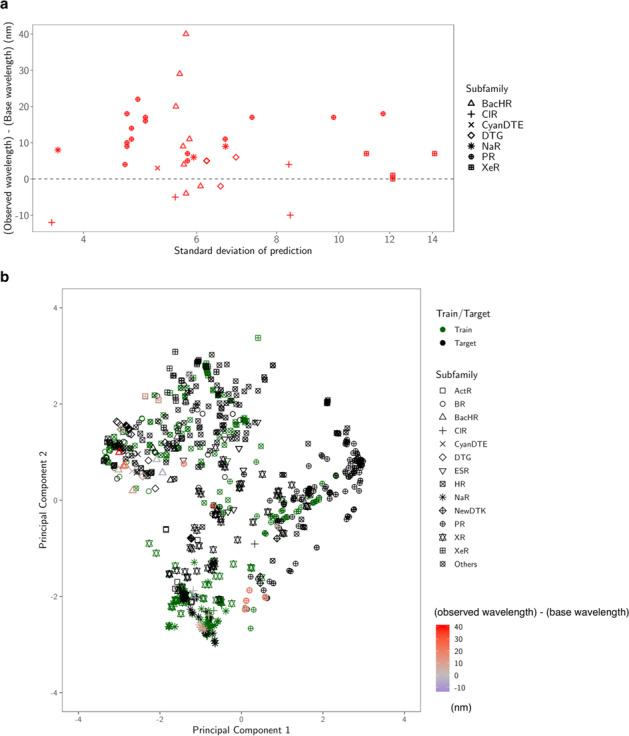
Fig. 7. Diversity of the selected proteins.

a Predicted standard deviation (horizontal axis) vs. observed gain (vertical axis). The marker shape represents the subfamily of each protein. b Two-dimensional projection created by principal component analysis. The original d = 432 dimensional feature space is projected onto the first two principal component directions. The first component (horizontal axis) explains 33% of the total variance of the original space, and the second (vertical axis) explains 17%. The green markers are the training data, and the black markers are the target data. For the synthesized proteins, differences in the observed and base wavelengths are shown by the color map. The results indicate that, by considering the exploration–exploitation trade-off, it was possible to make a red-shift protein screening process that considered not only the expected value of the prediction, but also the uncertainty.
