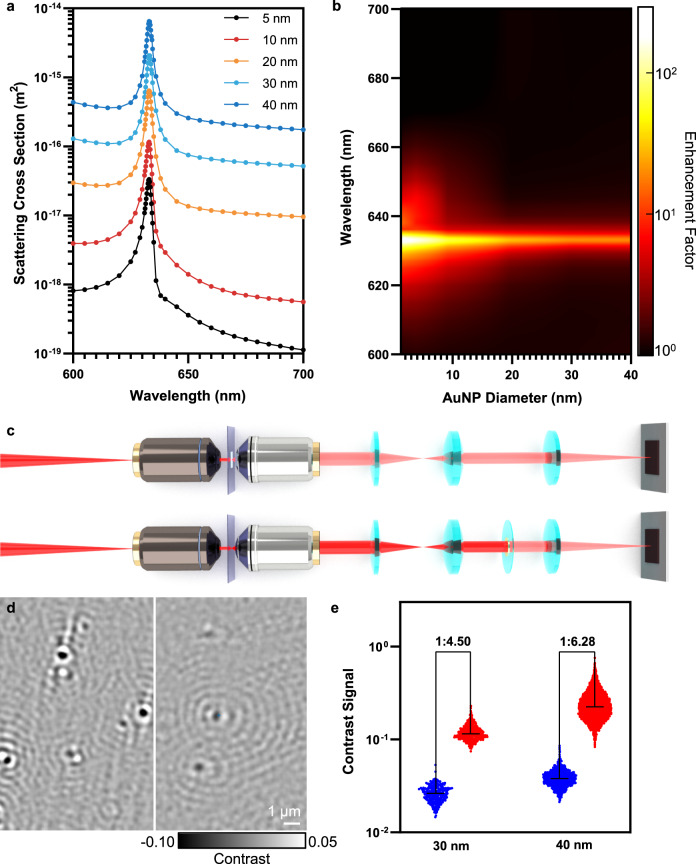
Fig. 4. Modeling and validation on guided resonance-enhanced scattering.
a FEM simulated scattering cross-section spectrum for AuNPs on a resonant PC surface. b Contour map of the PC enhancement factor on the AuNP scattering cross section as a function of AuNP diameter and excitation wavelength. c Schematic illustration of the PRISM system (upper) and interferometric scattering microscopy (iSCAT) with a gold disk placed in the Fourier plane to attenuate the reference beam (lower). d Representative differential interferometric images of AuNPs (d = 40 nm) obtained by PRISM (left) and iSCAT (right). e Comparison of signal contrast obtained respectively by PRISM (red) and iSCAT (blue). n > 400 for each size of AuNP.

