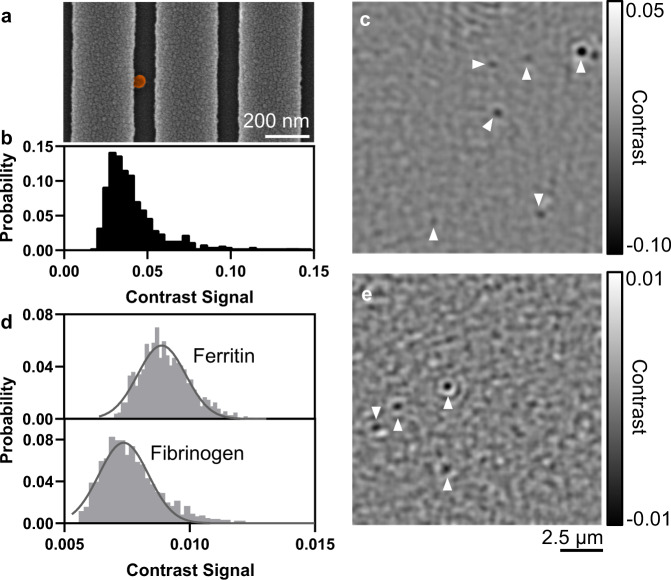
Fig. 5. Application of PRISM to detect individual viruses and protein molecules.
a False-colored SEM image of an inactivated SARS-CoV-2 virion on the PC substrate. b Contrast histogram obtained from over 500 individual virus signals. c, e Representative interferometric image with additional identifiers (white arrows) for coronaviruses and ferritin molecules within the field-of-view. d Distribution of contrast signal from individual ferritin (440 kDa, contrast: 0.88 ± 0.09%) and fibrinogen (340 kDa, contrast: 0.77 ± 0.09%). n > 1000 for each protein molecule.

