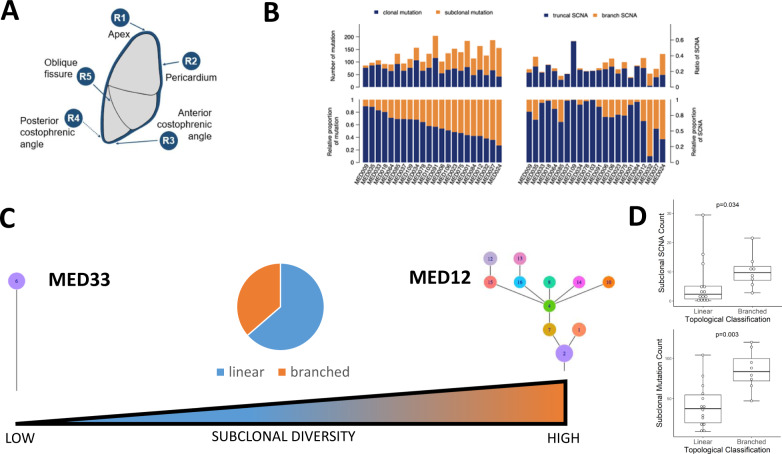
Fig. 1. Genomic intratumour heterogeneity in MPM.
A Pleural mesothelioma tissue sampling locations were consistent between patients involving the apex (region1, R1), the pericardium (R2), anterior costophrenic angle (R3), posterior costophrenic angle (R4) and the oblique fissure (R5). The rationale for selecting the anatomically sterotyped sites at the time of tissue sampling was to ensure maximum coverage of the tumour from superior to inferior; medial to lateral; and anterior to posterior. We chose the oblique fissure (R5) as this is common to both the right and left lung and could be a reliable anatomical site bilaterally. Spatial evolution of mesothelioma would be expected to be best reflected in samples at maximum distance from one another, reflecting the inherent intratumour heterogeneity. These regions are represented by the most superior region (R1) and the inferior (R3 and R4). B Inter-patient and intratumour heterogeneity in the MEDUSA22 cohort. Histograms summarising the variance in clonal versus subclonal mutations (left) compared with somatic copy number alterations (SCNAs, right). Left top, relative number of mutations, left bottom, proportion of mutations ranked by clonal mutation proportion ranging from maximum (left) to minimum (right). Right top, ratio of truncal SCNA versus branch SCNA. Right bottom, relative proportion of SCNA ranked as for mutations. C Spectrum of subclonal diversity in the MEDUSA22 cohort, ranging from linear topology (MED33 left) to branched (MED12 right). Centre, Pie chart showing the relative proportion of patients in the MEDUSA22 cohort classified as either linear (64%) or branched (36%). D Box plots showing the positive correlation between topology classified as either linear or branched, and subclonal SCNA count (two-sided Mann–Whitney U test p = 0.034, left) and subclonal mutation count (two-sided Mann–Whitney U test p = 0.003, right). n = 22 patients. Both box plots denote medians (centre lines), 25th and 75th percentiles (bounds of boxes), and minimum and maximum (whiskers).

