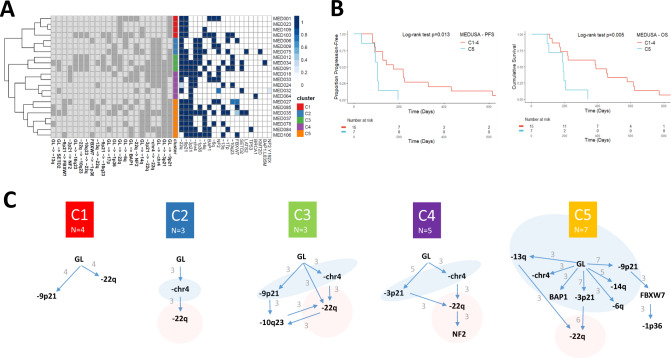
Fig. 3. Defining evolutionary trajectories and their prognostic significance in MPM.
A Heatmap showing the evolutionary clusters inferred by transfer learning and hierarchical classification. In the middle of the heatmap, five evolutionary clusters are defined and are vertically colour coded, with cluster 1 (C1) in red, C2 blue, C3 green, C4 purple and C5 orange (shown in the key on the right). On the left side of the heatmap, individual evolutionary transitions (i.e. mutational events including both SCNAs and mutations) are shown on the lower axis. The abbreviation GL corresponds to germline. Any transition occurring more than three patients is considered a repeated evolutionary transition. On the right the presence or absence of a mutation or copy number loss is shown. On the right, the probability of an event is presented by the shade of blue, with probability = 1 being dark blue. B Kaplan-Meier curves showing (left) shorter progression-free (two-sided Log-rank test p = 0.013; hazard ratio 3.52; 95% confidence intervals: 1.22, 10.13) and (right) lower overall survival (two-sided Log-rank test p = 0.005; hazard ratio 4.43; 95% confidence intervals: 1.42, 13.77) of C5 MPMs compared to other evolutionary clusters (C1–C4). n = 22 patients. C Inferred evolutionary trajectories involving repeated transitions in more than three patients. Somatic events that are exclusively early clonal (germline (GL) transitions) are encompassed by a light blue area. Conversely, exclusively late clonal transitions are highlighted in red. The specific number of patients exhibiting repeated transitions is shown as numbers against the directed edges (transitions).

