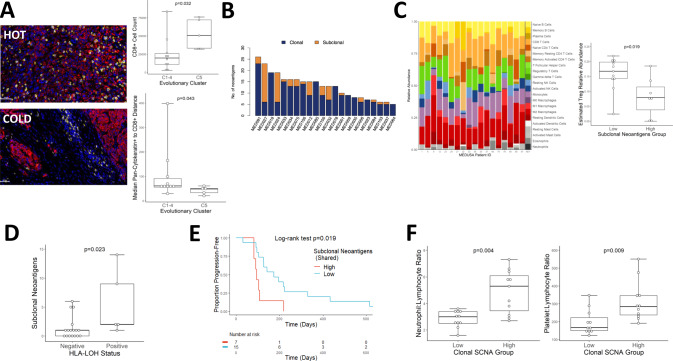
Fig. 4. Clonal architecture shapes the immune microenvironment in MPM.
A Left. Representative immunofluorescence micrographs contrasting cluster C2 CD8+ exclusion (“COLD”, MED75) with a highly infiltrated C5 tumour (“HOT”, MED35). Yellow: CD8; Red: Pan-Cytokeratin; Blue: DAPI (nuclei). Original magnification ×400. Scale bars represent 50 μm. Right. Higher CD8+ T-cell infiltration associated with evolutionary cluster C5 by cell count (Two-sided Mann–Whitney U test p = 0.032) and Pan-Cytokeratin to CD8 distance (two-sided Mann–Whitney U test p = 0.043). n = 15 patients. Both box plots denote medians (centre lines), 25th and 75th percentiles (bounds of boxes), and minimum and maximum (whiskers). B Histogram showing the relative number of neoantigens across the MEDUSA22 cohort, colour coded as either clonal (blue) or subclonal (orange) ranked from maximum (left) to minimum (right). C Left. Stacked column chart summarising the relative proportion of tumour infiltrating leucocytes enumerated by digital cytometry using CIBERSORT. Right, box plot showing a significantly higher Treg abundance in MPMs with lower neoantigen diversity (two-sided Mann–Whitney U test p = 0.018). n = 18 patients. Box plot denotes median (centre line), 25th and 75th percentiles (bounds of box), and minimum and maximum (whiskers). D Box plot showing increased neoantigen intratumour heterogeneity (ITH) in patients with evidence of HLA LOH (two-sided Mann–Whitney U test p < 0.023). n = 22 patients. Box plot denotes median (centre line), 25th and 75th percentiles (bounds of box), and minimum and maximum (whiskers). E Kaplan-Meier plot showing significantly lower mortality for patients with a higher burden of subclonal (shared) neoantigens (two-sided Log-rank test p = 0.019; hazard ratio 3.14; 95% confidence intervals: 1.16, 8.51). n = 22 patients. F Box plots showing a significant interaction between clonal SCNA burden versus neutrophil-lymphocyte ratio (NLR, left, two-sided Mann–Whitney U test p = 0.004) and platelet-lymphocyte ratio (PLR, right, two-sided Mann–Whitney U test p = 0.009). n = 22 patients. Both box plots denote medians (centre lines), 25th and 75th percentiles (bounds of boxes), and minimum and maximum (whiskers).

