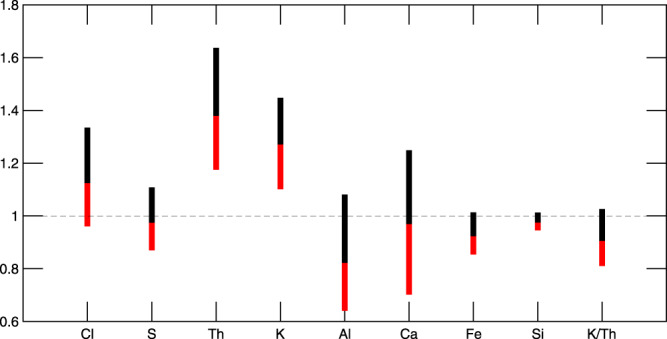
Fig. 3. A Modified box-and-whiskers diagram to non-parametrically compare the distribution of major and minor elements, within the Th and K enriched region of Eridania, to the average Martian crust.

The distributional high within Eridania is represented by 75th percentile/25th percentile ratio at top of the upper box, the low by 25th/75th percentile ratio by the bottom of the lower box and the typical by the ratio of medians as the boundary between them. Deviation from unity, even at a small fraction, highlights instances of notably distinct regional chemistry relative to the crust, such as for Fe, Si, K, Th, and K/Th.
