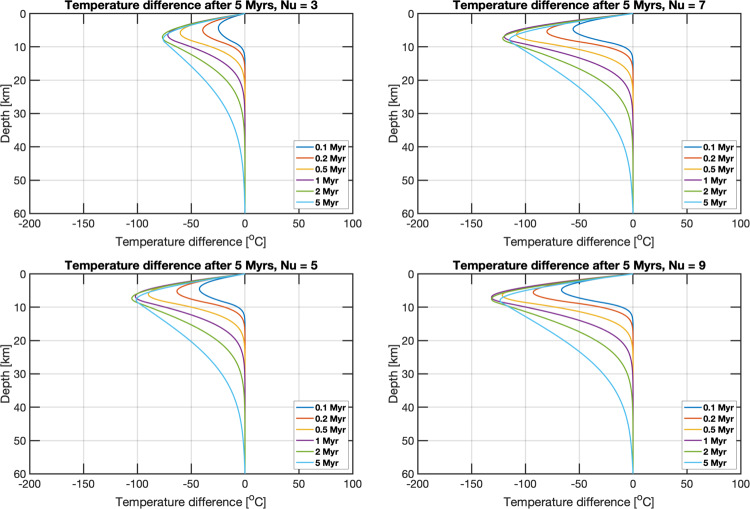
Fig. 4. Temperature difference as a function of depth relative to the purely conductive thermal profile for simulations of different Nusselt numbers (Nu).
The four panels show the difference in temperature between a purely conductive thermal profile and thermal profiles due to hydrothermal circulation. The vigor of the hydrothermal circulation is given by the Nusselt number (Nu). The different colored lines show the temperature profile at various timescales up to 5 million years.

