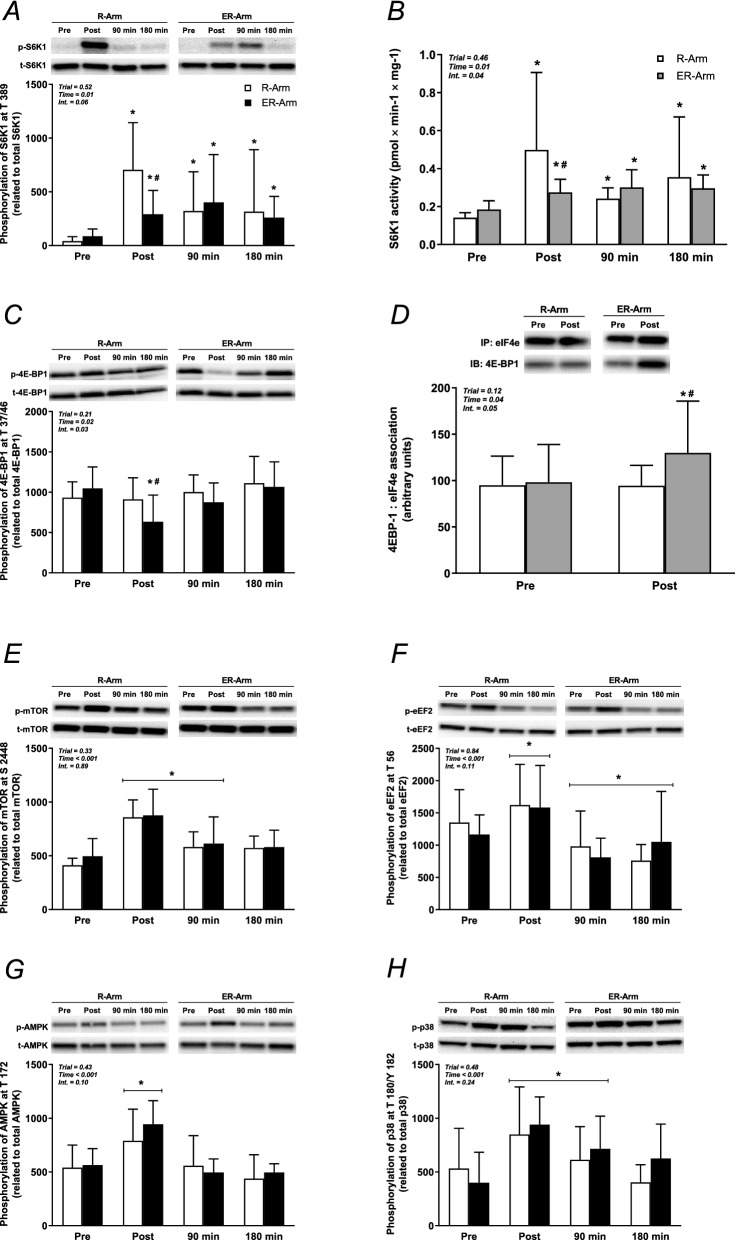
Figure 4.
Phosphorylation of S6K1 at Thr389 (A), kinase activity of S6K1 (B), phosphorylation of 4E-BP1 at Thr37/46 (C), the total amount of 4E-BP1 immuoprecipitated together with eIF4E (D), phosphorylation of mTOR at Ser2448 (E), eEF2 at Thr56 (F), AMPK at Thr172 (G) and p38 at Thr180/Tyr182 (H) at different stages of both trials. The values presented are means ± SD for 8 subjects. *P < 0.05 vs. Rest, #P < 0.05 vs. the R-Arm trial. Symbols denoted with a line represent a main effect. Symbols without a line represent an interaction effect with corresponding significant differences in the post-hoc analysis. Representative immunoblots (from strips of full-length blots) of both phosphorylated (upper panel, except for IP) and total protein (lower panel) from one subject are shown above each graph. The two sets of bands have been rearranged, and separated with a white space, to fit the order of the trials in the graphs. Pre = baseline, Post = immediately after exercise, 90 and 180 min = length of recovery.

