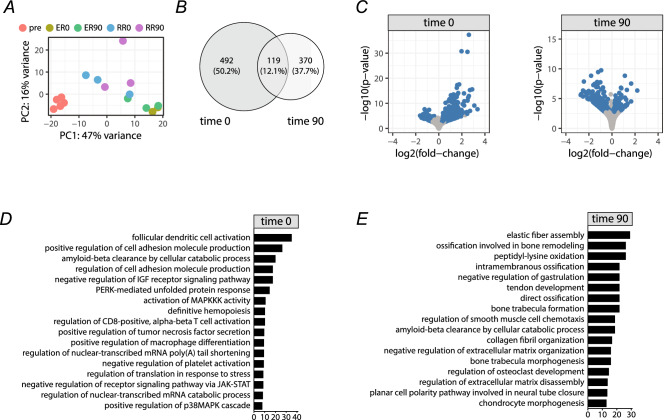
Figure 6.
Initial analysis of ER-Arm: R-Arm RNASeq data. PCA plot of individual samples shows good clustering of pre-training samples and individual exercise protocols (A). Analysis of differentially expressed genes identified 611 genes expressed differentially at time 0 min (immediately after the exercise) and 489 genes expressed differentially 90 min after the exercise. Out of these, 119 were common (B). Volcano plots of expression fold changes with relation to p-values for individual analyzed time points. R-Arm protocol was chosen as a baseline (C). Top PantherDB-Gene Ontology pathways identified based on differential expression of genes between ER-Arm and R-Arm exercise protocols at two different time points (0 min, 90 min) (D, E).

