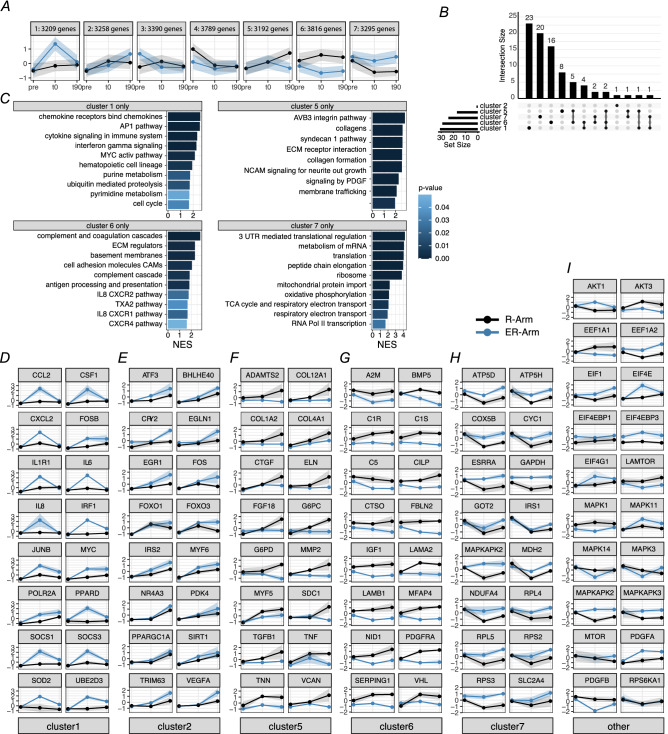
Figure 7.
Clustering of gene expression for R-Arm (black lines) and ER-Arm (blue lines) RNASeq at different time points (0 min, 90 min). K-means clustering based on gene expression and fold-changed in individual time points identified 7 cluster with distinct expression profiles (A). Pathway analysis of individual clusters by GSEA, with genes ranked by fold-change/standard deviation ratio identified both distinct and common pathways, shown as upset-plot (B). Pathways exclusive to individual clusters with their respective normalized enrichment score (NES) are plotted with their p-value indicated by color (C). Only single pathway (Smad2/3 nuclear signaling) has been identified for cluster 2 and is not shown. Expression profiles of selected genes for individual clusters (D–H). Expression profiles of selected genes that either play role in protein synthesis or show interesting complementary expression patterns (I).

