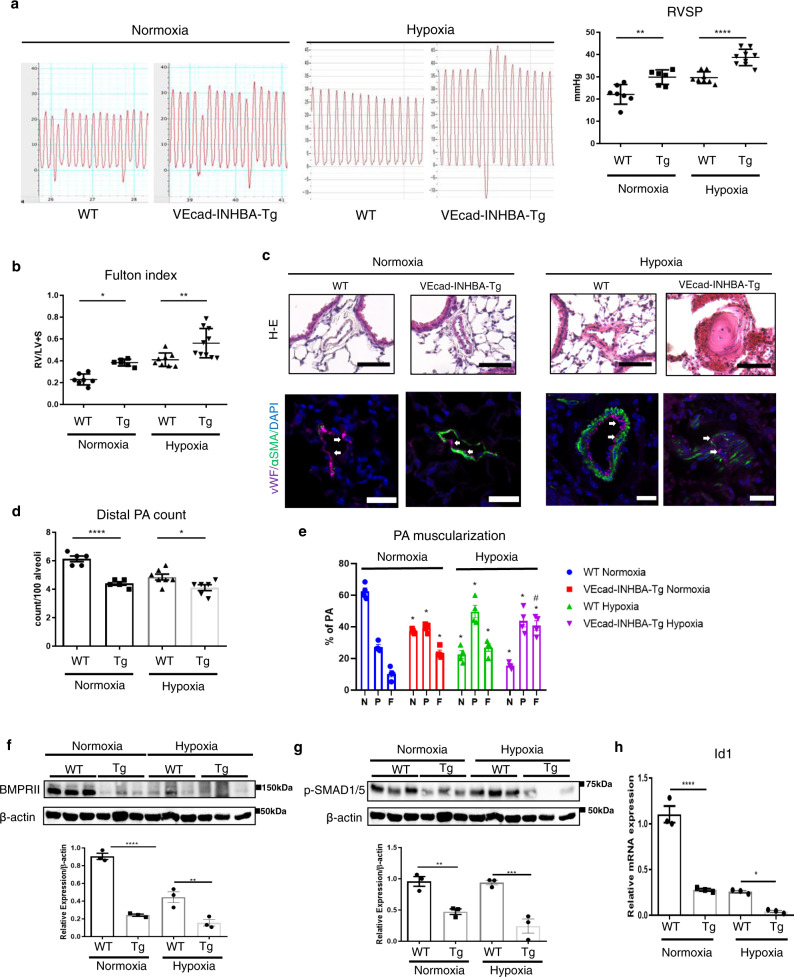
Fig. 5. Target activation of INHBA in ECs exacerbates PH in association with impaired BMPRII signaling.
a Representative right ventricle pulse waves and RVSP in WT and VEcad-INHBA-Tg mice under either normoxic or 3-week hypoxic (10% O2) conditions (n = 7 biologically independent animals for normoxia WT; n = 6 for normoxia TG; n = 7 for hypoxia WT; n = 9 for hypoxia Tg). b Fulton’s index (right ventricular to left ventricular plus septum weight ratio) measurements in WT and VEcad-INHBA-Tg mice (n = 7 biologically independent animals for normoxia WT; n = 6 for normoxia TG; n = 8 for hypoxia WT; n = 10 for hypoxia Tg). c Representative images of hematoxylin and eosin and immunofluorescence staining with an EC marker (vWF; in magenta color) and SMC marker (α-SMA; in green color) with DAPI in the lungs of WT and VEcad-INHBA-Tg mice. Arrows indicate vWF-positive ECs. Bars: 50 μm. Similar results were obtained in five biologically independent samples. d, e Quantitation of the distal pulmonary artery (20–50 μm) count per 100 alveoli (d) (n = 5 biologically independent values for normoxia WT and normoxia Tg; n = 7 biologically independent values for hypoxia WT; n = 6 biologically independent values for hypoxia Tg) and muscularized distal pulmonary artery (e) (n = 4 biologically independent values in each group) in the lungs of WT and VEcad-INHBA-Tg mice. The number of no-muscularized (N), partially muscularized (P), and fully muscularized distal arteries were counted. f, g Immunoblots and densitometric analysis for BMPRII (f) and phospho-SMAD1/5 (g) in the lungs of WT and VEcad-INHBA-Tg mice (n = 3 biologically independent samples in each group). h Quantitative PCR for Id1 in ECs isolated from the lungs of WT and VEcad-INHBA-Tg (n = 3 biologically independent samples in each group). ****P < 0.0001; **P < 0.01; *P < 0.05; #, not significant (P > 0.05). Exact P values are shown in the Source data file. Data are presented as the mean ± SEM. Two-sided Student’s t-test was used to analyze the differences between the WT and VEcad-INHBA-Tg groups in the distal PA count (d), BMPRII and pSMAD1/5 western blot quantitation (f and g), and Id1 mRNA expression levels (h). One-way ANOVA with Tukey’s post hoc test for multiple comparisons was used to analyze the differences between each study group in the RVSP and Fulton index measurements (a and b). Two-way ANOVA with Tukey’s post hoc test for multiple comparisons was used to analyze the differences between each study group in the PA muscularization (e).

