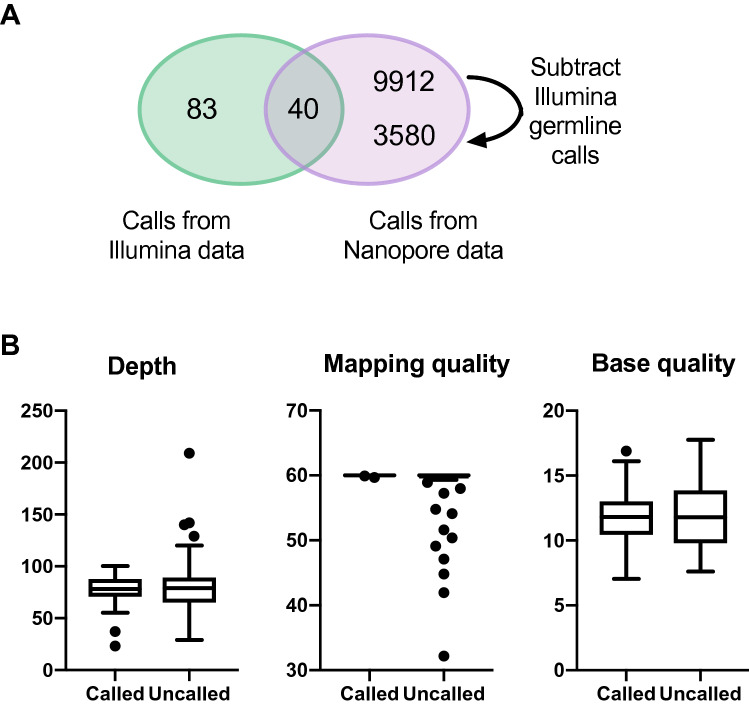
Figure 1.
Comparison of somatic SNV calls from short-read and Nanopore data sets. (A) Venn diagram to show the overlap between somatic SNV calls from the short-read (green) and Nanopore (purple) data for chromosome 17. The two numbers in the Nanopore-only sector show the number of calls before (top) and after (bottom) subtraction of short-read germline calls. Note that the total number of Nanopore calls prior to subtraction is 9912 + 40 = 9952, and the total after subtraction is 3580 + 40 = 3620. (B) Read depth, average mapping quality and average base quality calculated from Nanopore reads covering each of the 123 sites at which an SNV is called in the short-read data. Sites are portioned into those at which an SNV was called vs uncalled in the Nanopore data. Boxes span the interquartile range, with the median marked as a horizontal bar, while whiskers mark the farthest points that are not outliers.

