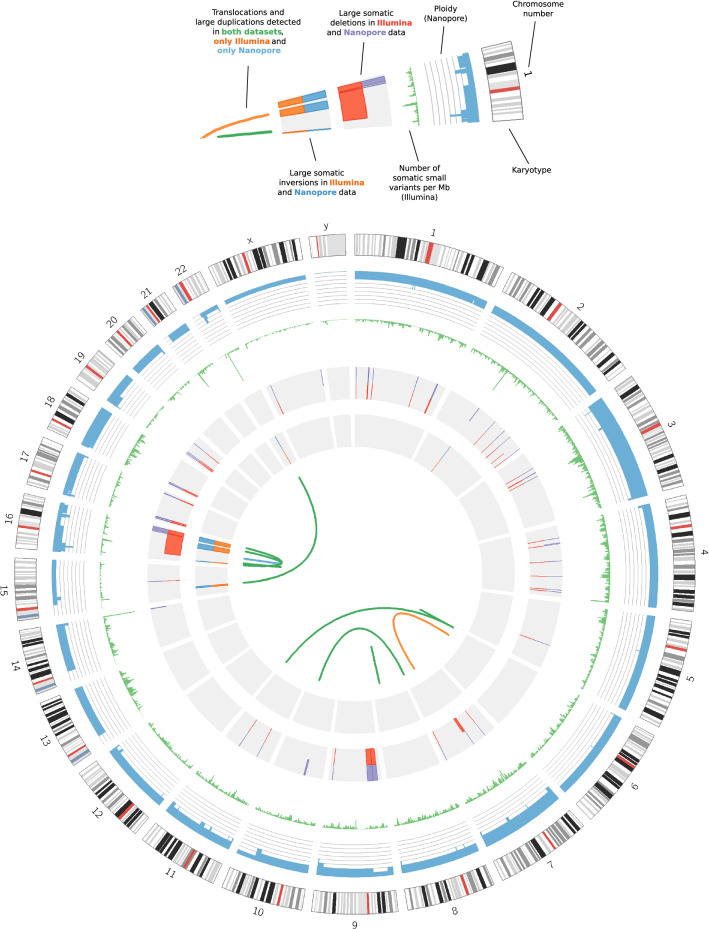
Figure 3.
Circos44 plot. Rings from outside in: (1) Human karyotype for assembly GRCh37. (2) Ploidy of the tumour sample (blue), with radial axis ranging from 0 to 8 and grey lines corresponding to each integer value. Data generated from Nanopore read counts (see Methods). (3) Number of somatic small variants per Mb in the Illumina short-read data (green). (4) Large somatic deletions detected in the Nanopore data (purple, outer half) and Illumina short-read data (red, inner half). Only those assessed as true somatic variants are shown. (5) Large somatic inversions detected in the Nanopore data (blue, outer half) and Illumina short-read data (orange, inner half). Again, only true somatic variants are shown. (6) Links denoting verified translocations and duplications detected in both datasets (green), one translocation detected only in the Illumina short-read data (orange), and one duplication detected only in the Nanopore data (blue).

