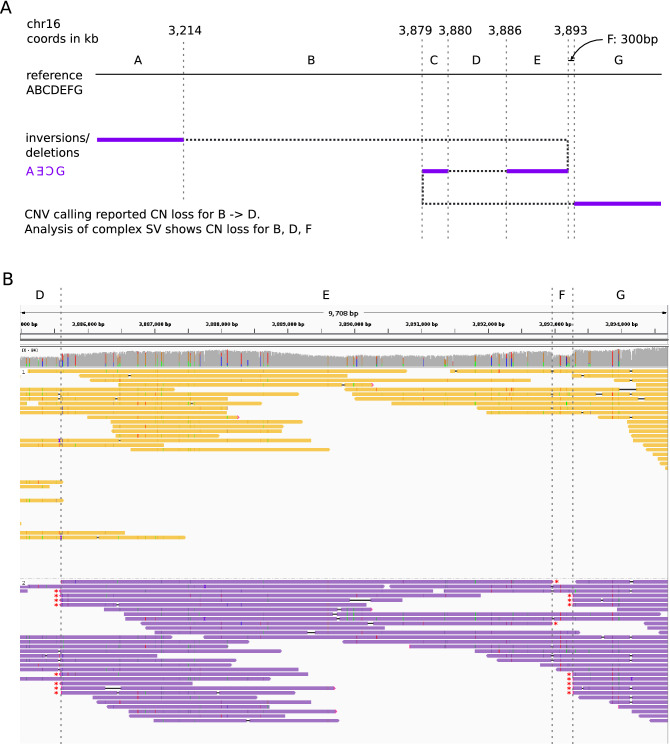
Figure 4.
(A) Diagram to show the reconstruction of a complex somatic structural rearrangement comprising three deleted segments and two inverted segments. Top: arrangement of segments in the reference sequence, and coordinates of SV breakpoints given to the nearest kilobase. Breakpoints are indicated by vertical dashed lines. Bottom: The rearranged haplotype is obtained by following the path of the dotted/purple line, with purple sections indicating the included segments. The inversion breakpoints between segments A–E and segments C–G both span over 10 kb and were reported by both Manta (short-read data) and Sniffles (long-read data). (B) Integrative Genomics Viewer screenshot showing Nanopore reads for the tumour sample, grouped and coloured by haplotype as determined by WhatsHap. Again, vertical dashed lines indicate the position of breakpoints and segments are labelled with letters as in (A). Split ends supporting the breakpoints are indicated with a red asterisk. All reads supporting all 3 breakpoints are assigned to the lower (purple) haplotype, confirming all breakpoints in (A) as in cis. Note that it would not have been possible to confidently phase these breakpoints from the short-read data alone. The nearest heterozygous SNVs to section F are at 3,887,048 and 3,895,908. This means it is not possible to say whether the breakpoints at A|E and E|C are in phase, nor whether A|E and C|G are in phase.

