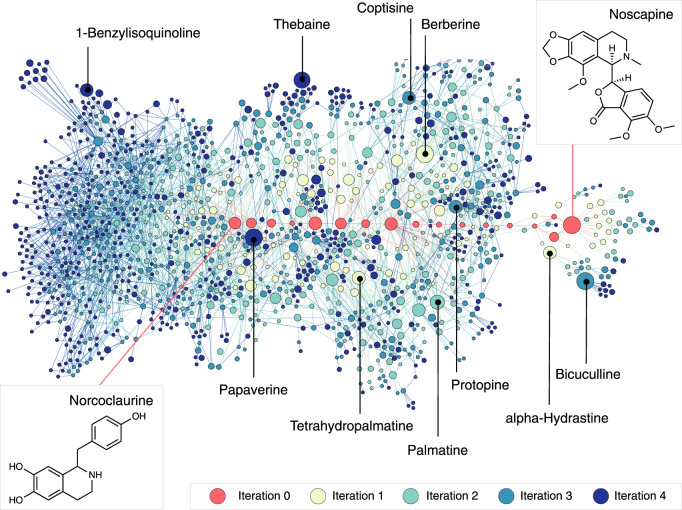
Fig. 2. Visualization of the expanded biosynthesis network of the noscapine pathway.
The nodes and edges drawn in red show the original noscapine pathway. Around the original pathway, the predicted network of compounds (nodes) and reactions (edges) is visualized. The top 10 compounds in terms of popularity (total number of patents plus citations) are named and localized on the map. The color of the nodes shows in which iteration the compound was generated in the network reconstruction process, which is also the number of reaction steps between the original pathway and the compound. The size of the nodes is proportional to the popularity. The molecular structure of the pathway precursor, norcoclaurine, and the final product, noscapine, are shown.

