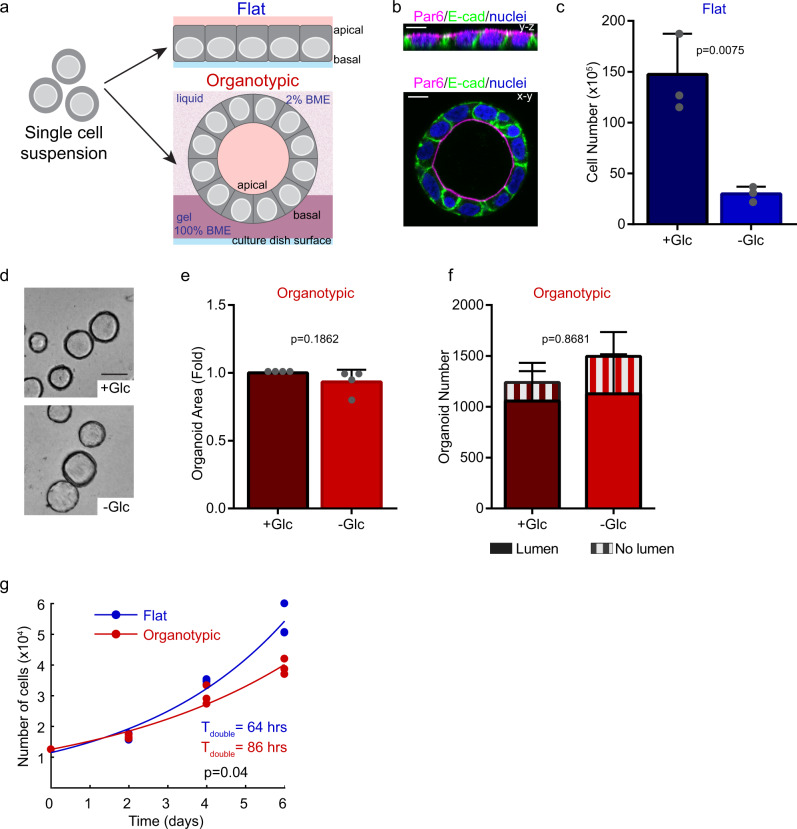
Fig. 1. Epithelial architecture is associated with glucose-dependent growth.
a Diagram depicting experimental model whereby Caco-2 cells were seeded as flat or 3D organotypic monolayer cultures. Blue lines at the bottom represent the dish surface. For 3D organotypic cultures, cells were semi-embedded in gel matrix: Dark purple represents solid gel matrix (100% basement membrane extract, BME) and light purple represents liquid matrix (2% BME). b Fluorescent micrographs showing Caco-2 cells immuno-stained with E-cadherin (basolateral marker; green) and Par6 (apical marker; magenta) to indicate epithelial organization of the cell monolayers. c Bar chart showing quantification of Caco-2 cell numbers. Flat/2D cells were seeded and cultured for 6 days in the presence (+Glc) or absence (−Glc) of glucose (r = 3 independent replicates). d Brightfield images showing representative fields of Caco-2 organotypic cultures. Cells were cultured for 6 days in the presence (+Glc) or absence (−Glc) of glucose. Images show cysts with a hollow lumen, that appear as rings in cross-section images. Scale bars = 50 μm. e Bar chart showing quantification of Caco-2 cross-section area following 6-days of organotypic culture in the presence (+Glc) or absence (−Glc) of glucose (n = 3715 spheroids (+Glc), n = 4195 spheroids (−Glc)), (r = 4 independent replicates). f Bar chart showing morphology (lumen formation) of Caco-2 organotypic cells in the presence (+Glc) or absence (−Glc) of glucose (n=2476 (+Glc), n = 2992(−Glc)), (r = 2 independent replicates). g Scatter plots showing number of Caco-2 cells at 0, 2, 4, and 6 days of growth in flat or organotypic culture. Data were fit to exponential growth models (solid lines; R2flat = 0.99; R2organotypic = 0.97), (r = 3 independent replicates). All error bars are standard deviation.

