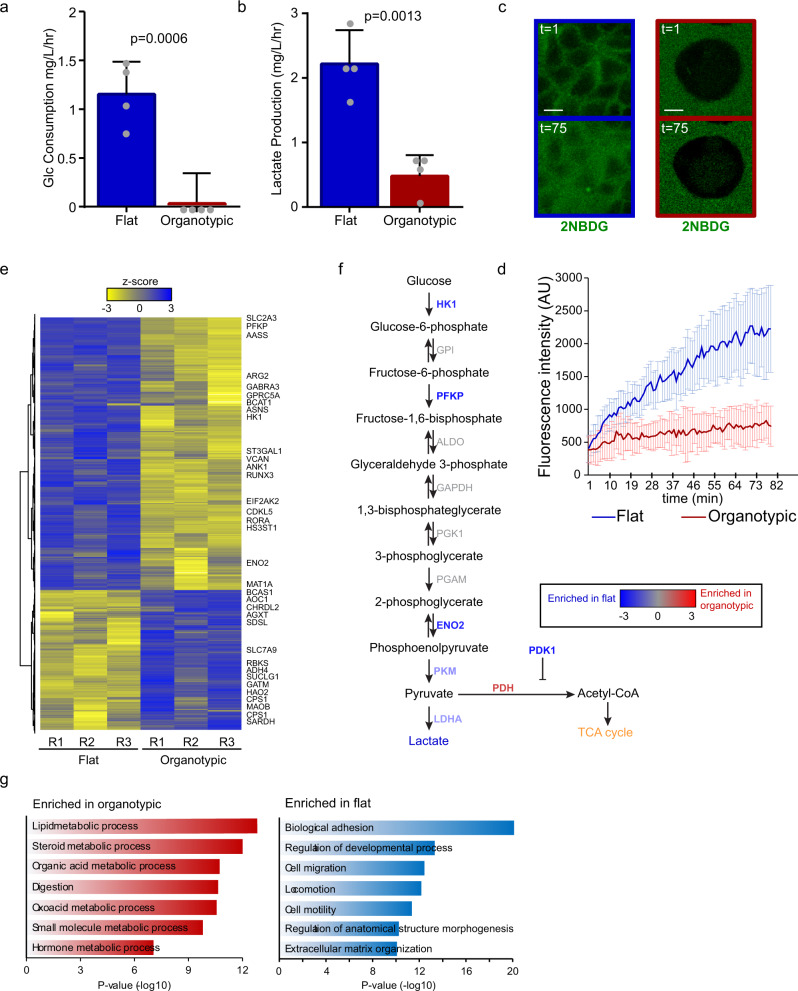
Fig. 2. Different epithelial architectures use unique glycolytic programs.
a Bar chart showing rate of glucose consumption from culture medium. Caco-2 cells were cultured for 6 days flat and organotypic cultures and the rate of glucose uptake (mg/L/h) was calculated. (r = 4 independent replicates). b Bar chart showing rate of lactate production from culture medium. Caco-2 cells were cultured for 6 days flat and organotypic cultures and the rate of lactate secretion (mg/L/h) was calculated. (r = 4 independent replicates). c Representative fluorescent images showing the glucose analog FITC-2-NBDG at initial (t = 1) and endpoint (t = 75). At the initial timepoints, dark regions are cells and the green show FITC-2-NBDG in the extracellular medium. Scale bars = 10 μm. d Line graph showing fluorescence uptake of the glucose analog FITC-2-NBDG for flat (n = 78 cells) and organotypic (n = 38 cells) Caco-2 cultures (r = 2 independent replicates). Cells were imaged every 2 min to observe and measurements made from intracellular regions. e Heatmap showing clustered RNA-seq data from 3 replicates (R1-R3) of Caco-2 cells from flat and organotypic cultures. Selected significantly altered metabolic genes (z-score threshold ±2) are displayed on the right. The full list of differentially expressed genes is available in Supplementary Data 1. f Pathway map for glycolysis showing differentially expressed genes and the reactions they catalyze. g Results of top-ranked Gene Ontology processes enriched in organotypic and flat Caco-2 cultures based on differentially expressed genes. All error bars are standard deviation.

