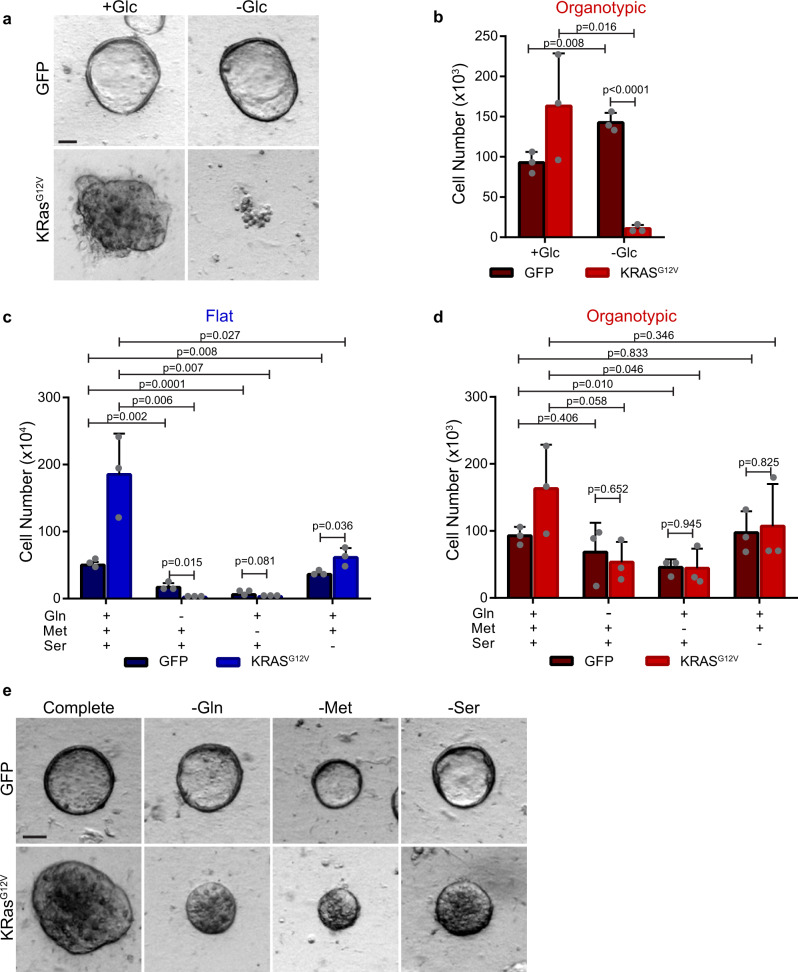
Fig. 6. Organotypic cultures have reduced metabolic plasticity with Ras-driven glucose addiction.
a Representative brightfield images of control (GFP) or KRASG12V-expressing Caco-2 cells after 6 days of organotypic culture in the presence (+Glc) or absence (−Glc) of glucose. GFP-expressing control cells display a hollow lumen, whereas KRASG12V-expressing appear solid. Scale bars = 50 μm. b Bar chart of Caco-2 cell numbers depicted in organotypic cultures from a). Caco-2 cells were seeded in flat/2D or organotypic cultures and were counted after 6 days in culture. (r = 3 independent replicates). c Bar chart showing cell numbers of control (GFP) and KRASG12V cells after 6 days of growth in the presence (+) or absence (−) of glutamine (Gln), methionine (Met), and serine (Ser). (r = 3 independent replicates). d Bar chart showing cell number from organotypic cultures of control (GFP) and KRASG12V cells in the presence (+) or absence (−) of glutamine (Gln), methionine (Met), and serine (Ser) (r = 3 independent replicates). e Representative brightfield images showing organotypic control (GFP) and KRASG12V-expressing cells in complete medium or medium free of glutamine (−Gln), methionine (−Met), or serine (−Ser). Scale bars = 50 μm. All error bars are standard deviation.

