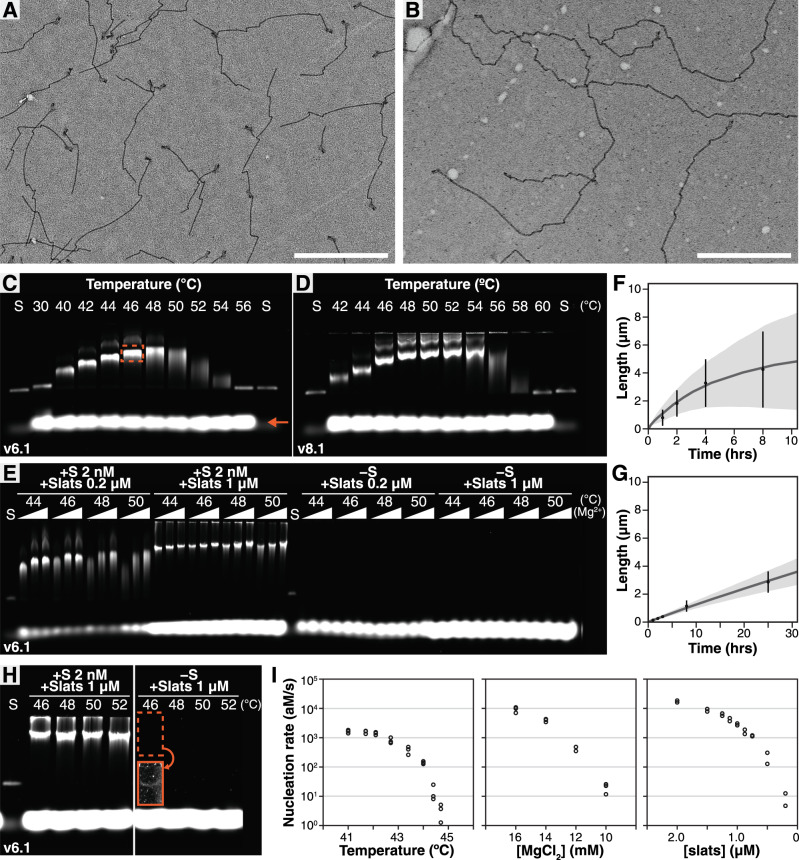
Fig. 3. Characterization of DNA slat assembly with and without the seed.
Negative-stain TEM images of v6.1 (A 2 nM seed, 1 µM each slat, 16 mM MgCl2, and 50 °C for 1 h) and v8.2 (B 2 nM seed, 0.5 µM each slat, 16 mM MgCl2, and 50 °C for ~16 h) seeded ribbons, with 1 µm scale bars. C, D Agarose gels of seeded v6.1 and v8.1 ribbons using 14 mM MgCl2, 0.2 µM each slat, and 2 nM origami seed. Dotted orange boxes are ribbons, orange arrow points to unpolymerized slats (each slat is in 100-fold excess to the seed in the reaction), and “S” is the origami seed. E Agarose gel of v6.1 slats incubated ~16 h (0.2 or 1 µM each slat and 2 nM origami seed), with the Δ showing 12, 14, or 16 mM MgCl2. F, G Length of seeded v6.1 ribbons versus time from TEM for a fast-growth high temperature and a slow-growth low temperature, respectively. Data points are the mean ± SD length (F N1h = 163, N2h = 130, N4h = 141, N8h = 140; G N1h = 155, N2h = 168, N3h = 154, N8h = 161, N25h = 151; with error bars obscured by data points). Gray interpolating lines are mean lengths from the stochastic model (N = 150 ribbons, with shaded range ±SD). H Extended 100 h incubation of v6.1 slats. I Rate of spontaneous nucleation versus reaction parameters for v6.1. Results are representative of three independent experiments for temperature and MgCl2, and two independent experiments for slat concentrations.

