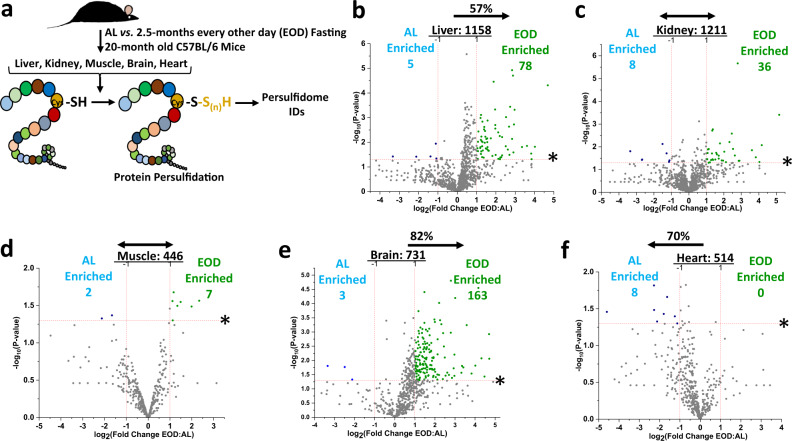
Fig. 5. Late-life initiated every other day (EOD) fasting for 2.5 months transforms tissue-specific persulfidomes similar to short-term DR in young adult mice.
a Graphical presentation of the overarching experimental setup. Twenty-month-old male C57BL/6 mice were placed on ad libitum (AL) or Every Other Day (EOD) fasting for 2.5 months prior to tissue collection. Tissues were analyzed for protein persulfidation via the biotin thiol (BTA) assay. b–f Volcano plots showing differentially abundant persulfidated proteins in liver (b), kidney (c), quadriceps muscle (d), whole brain (e), and heart (f) from AL fed (n = 5 mice/group) versus 2.5 months of EOD fasting (n = 5 mice/group) 20-month-old C57BL/6 male mice. The log2(Fold Change DR:AL) X-axis displays the average fold change in spectral counts for each identified persulfidated protein while the −log10 Y-axis displays the calculated P value from a two-sided Student’s t test when comparing the individual spectral count values for each identified persulfidated protein in a specific tissue from AL versus EOD fed mice. The non-axial red dotted vertical lines highlight the biological significance threshold of + /− twofold change in spectral counts between EOD versus AL, while the non-axial red dotted horizontal line with asterisk highlights our statistical significance threshold of P < 0.05. The number of total persulfidated proteins identified in each tissue are given next to the tissue name, while blue (AL enriched) and green (EOD enriched) colored dots and text indicate persulfidated proteins reaching both biological- and statistical-thresholds. Gray color dots indicate persulfidated proteins not reaching the criteria for both biological and statistical significance for enrichment under either diet. The percentage and direction of proteins skewed toward one diet type are provided above the tissue label. See also Supplementary Fig. 5.

