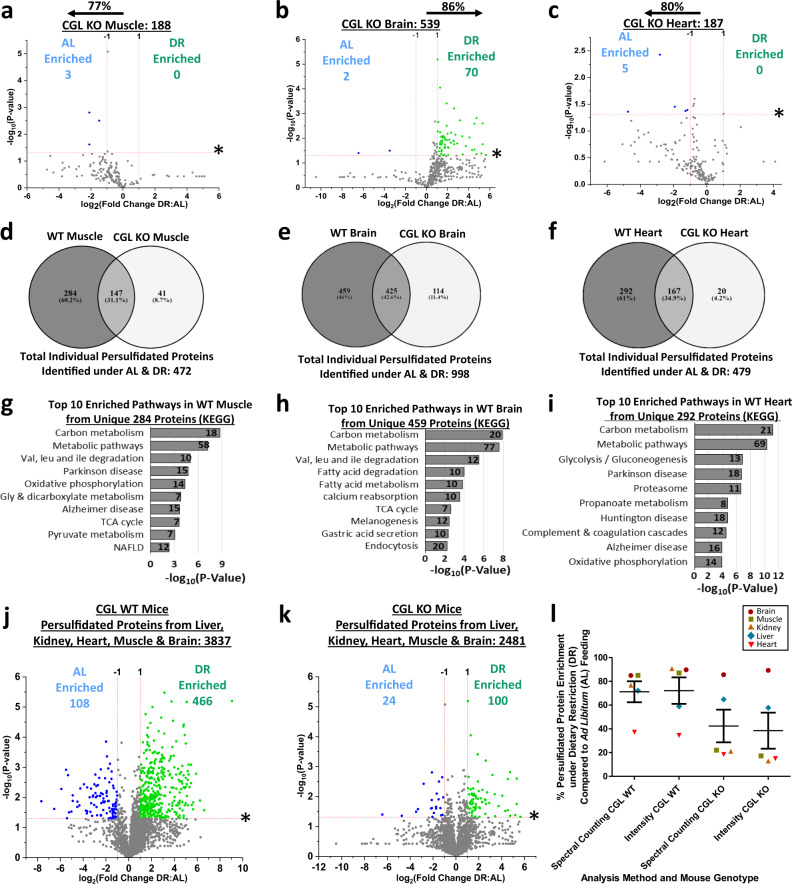
Fig. 8. CGL dependent and independent persulfidation and pathway enrichment in muscle, brain, and heart.
a–c Volcano plots showing differentially abundant persulfidated proteins in muscle (a), brain (b), and heart (c) from AL (n = 3 CGL KO mice/group) versus DR (n = 3 CGK KO mice/group). The log2(Fold Change DR:AL) X-axis displays the average fold change in spectral counts for each identified persulfidated protein while the −log10 Y-axis displays the calculated P value from a two-sided Student’s t test when comparing the individual spectral count values for each identified persulfidated protein from AL versus DR fed mice. Blue (AL enriched) and green (DR enriched) dots and text indicate persulfidated proteins reaching both biological (twofold enrichment)- and statistical (P < 0.05)- thresholds. Gray dots indicate persulfidated proteins not reaching the criteria for both biological and statistical significance under either diet. The percentage and direction of proteins skewed toward one diet type is provided above the tissue label. d–f Shared and unshared persulfidated proteins between CGL WT and KO muscle (d), brain (e), and heart (f). g–i Pathway analysis of persulfidated proteins unique to CGL WT muscle (g), brain (h), and heart (i). Numbers indicate the proteins involved in that specific pathway. Significance for pathway enrichment plotted as the adjusted −log10 (P value) and was auto-calculated via the g:Profiler g:SCS algorithm for KEGG database that utilizes multiple testing corrections. j, k Volcano plots and l dot plot re-imaging data from Figs. 2, 4, 7, and 8 showing differentially abundant persulfidated proteins in liver, kidney, muscle, brain, and heart from CGL WT AL versus CGL WT DR mice (j) and from CGL KO AL versus CGL KO DR mice (k) with the calculated P values from a two-sided Student’s t test when comparing individual spectral count values for each identified persulfidated protein from AL versus DR fed mice. In (l), the mean + /− SEM is plotted for % persulfidated protein enrichment under DR compared to AL feeding from each solid tissue in CGL WT and KO mice as determined through spectral counting or MS1 intensity. Source data are provided as a Source Data file. See also Supplementary Fig. 8.

