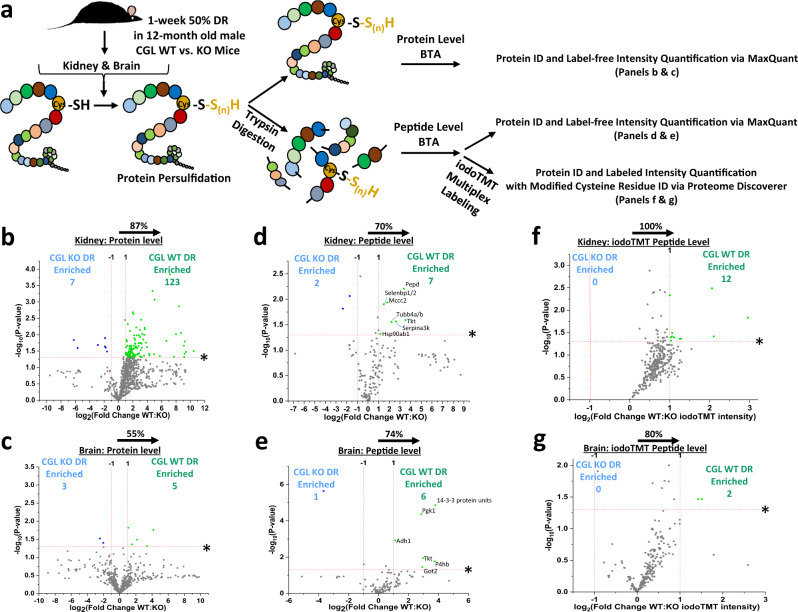
Fig. 9. Orthogonal protein and peptide-based biotin thiol assay (BTA) approaches show CGL dependence for DR-induced persulfidation shifts.
a Graphical presentation of experimental setup. Kidney and brain extracts from 12-month-old CGL WT and KO mice under 1 week 50% DR were subjected to protein level or peptide level BTA, LC-MS/MS, and analyzed via the given software platform (n = 3 mice/group). Furthermore, an additional peptide level BTA was subjected to iodoTMT labeling prior to LC-MS/MS for quantification and site-level analysis of cysteine residues (n = 3 mice/group). b–g Volcano plots showing CGL-dependent intensity shifts in DTT-eluted & unlabeled (b–e) or TCEP-eluted & iodoTMT labeled (f, g) persulfidated proteins. b, c Derived from unlabeled protein level BTA for kidney (b) and brain (c). d, e Derived from unlabeled peptide level BTA for kidney (d) and brain (e). f, g Derived from iodoTMT labeled peptide level BTA for kidney (f) and brain (g). The log2(Fold Change WT:KO) X-axis displays the average fold change in intensity for each protein, and the −log10 Y-axis displays the calculated P value from a two-sided Student’s t test when comparing the individual intensity values for each protein from WT versus KO mice. The non-axial red dotted vertical lines highlight the biological significance threshold of + /− twofold change in intensity, while the non-axial red dotted horizontal line with asterisk highlights the statistical significance threshold of P < 0.05. Blue (KO enriched) and green (WT enriched) dots indicate proteins reaching both biological- and statistical-thresholds. The percentage and direction of proteins skewed toward CGL WT is provided above the tissue label. See also Supplementary Fig. 9.

