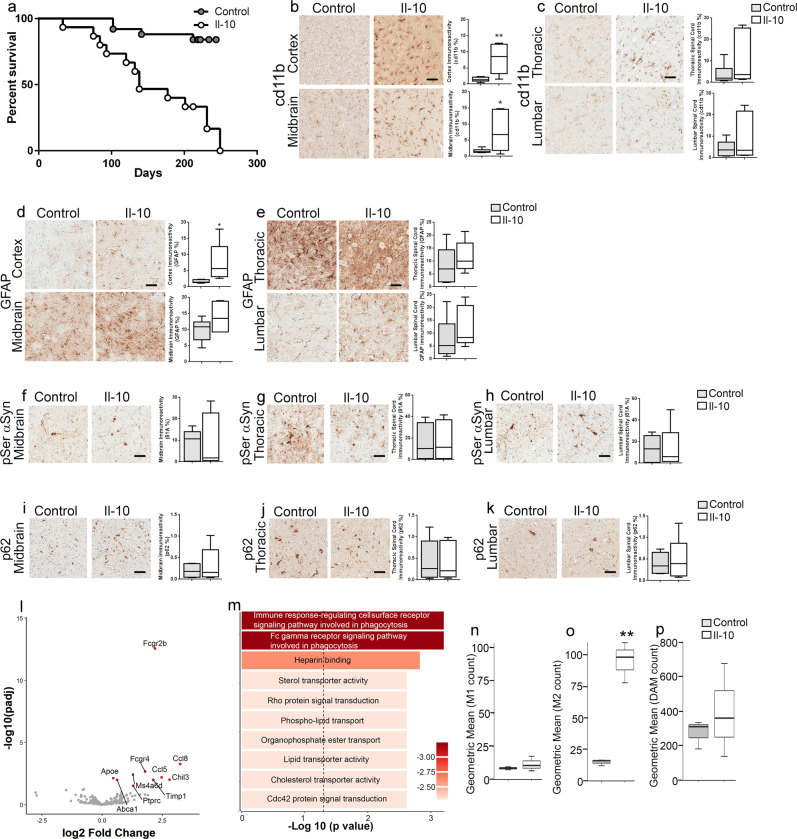
Fig. 1. Intraspinal Il-10 expression accelerates death in homozygous M83 mice.
a Intraspinal expression of AAV-Il-10 leads to early mortality in M83+/+ mice. The median age of survival of Il-10-expressing mice was 138 days, and the median age for the AAV-GFP-expressing mice was undefined (log-rank test, P < 0.0001, n = 15–16 mice/group). b, c Microgliosis (cd11b staining) in the brain (b, cortex and midbrain) and spinal cord (c, thoracic and lumbar segment) of M83+/+ mice. d, e Astrocytosis (GFAP staining) in the brain (d, cortex and midbrain) and spinal cord (e, thoracic and lumbar segment) of M83+/+ mice. f–k Representative images from anti-81A (f–h) and anti-p62 (i–k) antibody-stained tissue. Immunostaining analysis is shown from the midbrain (f, i), the thoracic segment of the spinal cord (g, j), and the lumbar segment of the spinal cord (h, k). Scale bar: 50 µm. n = 6 mice/group; two-tailed t test. l–p Volcano plot (l) showing differential expression of genes in the thoracic spinal cords of Il-10-expressing M83+/+ mice compared to GFP-expressing controls. Red dots, significantly changed genes, P < 0.05; gray dots, P > 0.05. To avoid skewing the graph, the x axis is limited to a range of −3 to +3 and as a result, Il-10 data is not shown (log2 FC = 13.49; Padj value = 1.64 × 10−51). Gene ontology analysis of overrepresented categories using a list of significantly changed genes from panel l (Padj < 0.05; dotted line) (m). n = 3 mice/group. FDR < 0.05. Padj = P values adjusted for multiple comparisons. n–p M1, M2-, and DAM-phenotype profile of microglia in Il-10-expressing M83+/+ mice compared to GFP-expressing M83+/+ control mice. **P < 0.01. n = 3 mice/group. In the box plot, the whiskers extend from the minimum to maximum values, with the midline representing the median.

