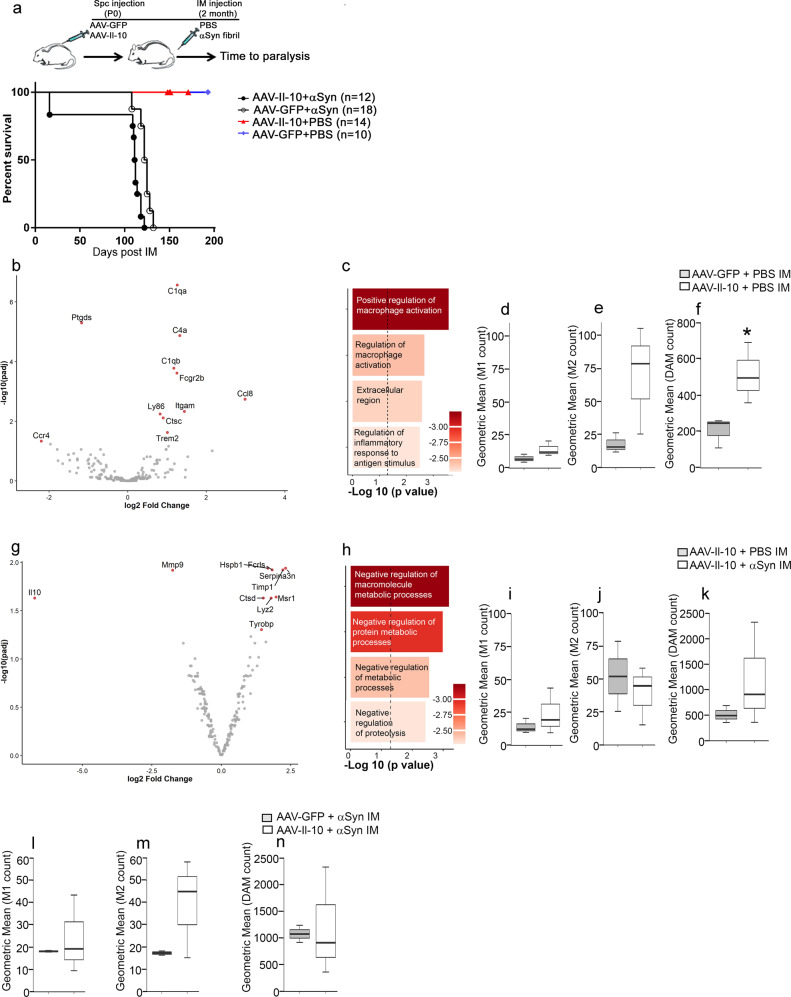
Fig. 2. Intraspinal expression of AAV-Il-10 leads to accelerated mortality in αSyn-aggregate-seeded hemizygous M83+/− mice.
a Schematic summarizing the experimental procedure (top panel). M83+/− neonates were injected intraspinally (Spc) with AAV-Il-10 or AAV-GFP (control). Mice were aged to 2 months and injected intramuscularly (IM) with preformed αSyn fibrils or PBS (vehicle control). Mice were aged to paralysis. The median age of survival of αSyn-seeded Il-10 or GFP-expressing mice was 112 days and 124.5 days post αSyn seeding respectively (log-rank test, P < 0.001, n = 10–18/group). b–n NanoString analysis of the αSyn or vehicle (PBS)-seeded thoracic spinal cords of M83+/− mice expressing Il-10 or GFP. b, c Volcano plot of differentially expressed genes (b) and gene ontology pathway analysis of overrepresented functional categories (c) accompanying Il-10 overexpression in M83+/− spinal cords (Padj < 0.05; dotted line). To avoid skewing the volcano plot, the x axis is limited to a range of −2.5 to +4 and as a result, Il-10 data is not plotted (log2 FC = 10.537; Padj value = 5.9e-07). d–f M1-, M2-, and DAM-type microglial profiling in Il-10-expressing M83+/− mice. Two-tailed t test, *P < 0.05. g, h Volcano plot of differentially expressed genes (g) and gene ontology pathway analysis of overrepresented functional categories (h; Padj < 0.05, dotted line) in αSyn-seeded Il-10-expressing M83+/− mice vs vehicle-seeded Il-10-expressing M83+/− mice. i–k M1-, M2-, and DAM-type microglial profiling in Il-10-expressing M83+/− mice in the presence or absence of intramuscular (IM) αSyn seeding. l–n M1-, M2-, and DAM-type microglial profiling in Il-10 vs GFP-expressing αSyn-seeded M83+/− mice. n = 3 mice/group. Red dots significantly changed genes, P < 0.05 and gray dots, P > 0.05 in volcano plots after adjusting for multiple testing and FDR < 0.05. In the box plot, the whiskers extend from the minimum to maximum values, with the midline representing the median.

