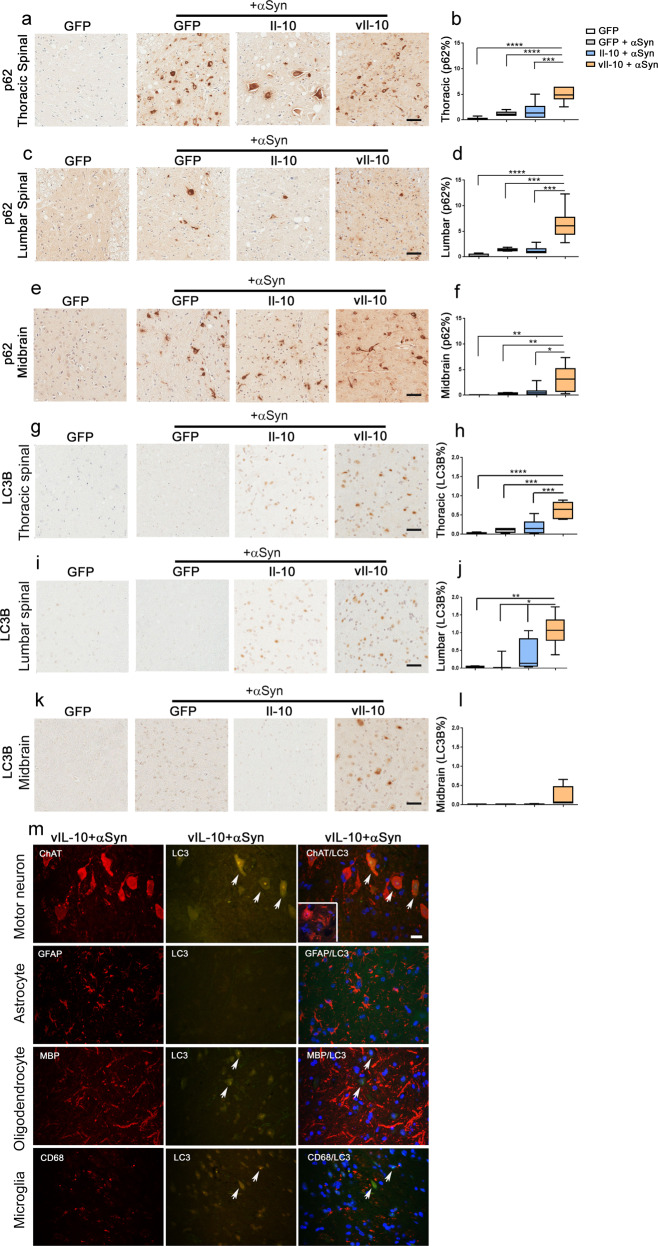
Fig. 7. Accumulation of autophagic markers in vIl-10-expressing αSyn fibril-seeded hemizygous M83+/− mice.
Neonatal M83+/− mice were injected with AAV-GFP, Il-10, or vIl-10 and were aged to 2 months when they were injected with αSyn fibrils in the muscle. PBS (vehicle) injection was the control for αSyn fibril injection and is represented by the immunohistochemistry panel on the left of each panel. Representative images of anti-p62/sequestosome antibody-stained tissue and immunostaining analysis (% immunoreactivity burden) from the thoracic spinal cord (a, b), lumbar spinal cord (c, d), and midbrain (e, f) are shown. Representative images from MAP1LC3B antibody-stained tissue and immunostaining analysis (% immunoreactivity burden) derived from the thoracic spinal cord (g, h), lumbar spinal cord (i, j), and midbrain (k, l) are shown. Of note, 2/5 mice in the Il-10-expressing seeded mice showed LC3B staining in the spinal cord. n = 5–7 mice/group; one-way ANOVA; ****P < 0.0001; ***P < 0.001; **P < 0.01; *P < 0.05. Scale bar, 50 µm. In the box plot, the whiskers extend from the minimum to maximum values, with the midline representing the median. m Representative images from the lumbar spinal cord showing robust localization of LC3B (arrows, middle panels) in ChAT-immunopositive neurons (arrows, top panel) but not in GFAP-immunopositive astrocytes, MBP-immunopositive oligodendrocytes, or CD68-immunopositive microglia of vIl-10-expressing Line M83+/− mice seeded with αSyn fibril. The right panels show merged images of LC3B (detected with Alexa fluor 488 nm) with cell type-specific markers (detected with Alexa fluor 594 nm). Slides were counterstained with DAPI. Inset in ChAT panel (right) denotes triple-color merged image from M83+/− mice seeded with αSyn fibril showing no detectable LC3B. Arrows (denoting LC3B signal) in MBP- and CD68-stained panels do not colocalize with oligodendrocyte or microglia, respectively. Scale bar, 10 µm.

