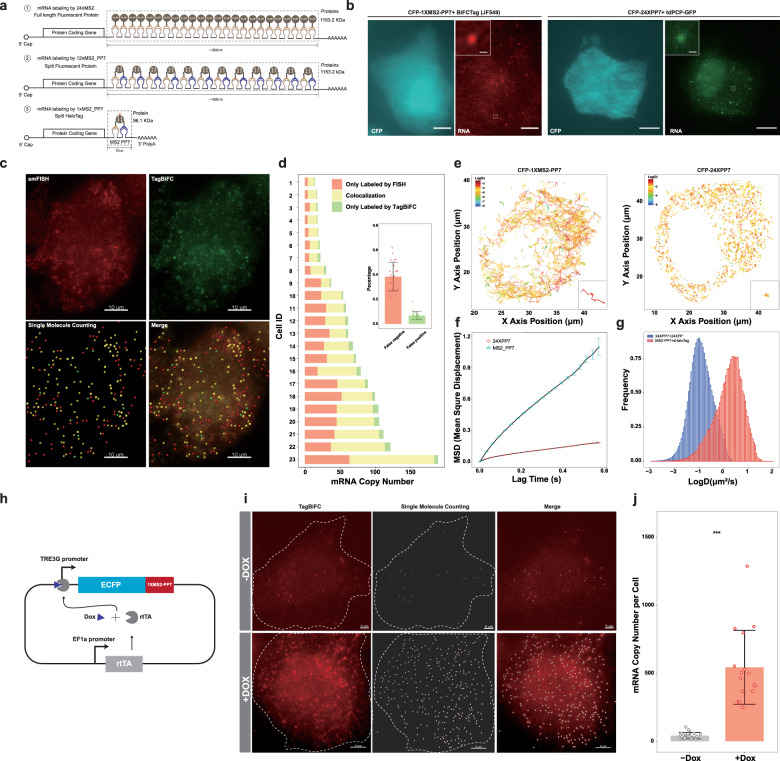
Fig. 5. Burden-lighter imaging of single mRNA and cirRNA molecules in live cells using TagBiFC.
a Schematic comparation of three single-molecule imaging methods of mRNAs in living cells. ① mRNA labeling using 24×MS2 hairpin repeats and full-length fluorescent protein fusion with tdMCP (or MCP). ② mRNA labeling using 12×MS2_PP7 hybrid hairpin repeats and split fluorescent protein fusion with MCP and PCP. ③ mRNA labeling using 1×MS2_PP7 hybrid hairpin repeat and BiFC-Tag fusion with MCP and PCP. The estimation of the labeling tag length and binding protein mass are shown. b Representative fluorescence images of single CFP mRNA labeling using 1×MS2-PP7/TagBiFC (left) or 24×PP7 (right). The 1×MS2-PP7 or 24×PP7 sequence was inserted in the 3’ UTR of coding sequence of CFP. tdPCP-HaloTag C58+HaloTag N58-tdMCP or tdPCP-EGFP was transfected to label the mRNA. Inset shows single-molecule signal from a high magnification of the box region. Scale bar, 5 μm. Inset scale bar, 1 μm. c Representative fluorescence images of single CFP mRNA 3D projection labeled using TagBiFC and single-molecule FISH. The mRNAs were counted using the Spots function of Imaris. Scale bar, 5 μm. d Quantification of the colocalization of TagBiFC and FISH signal in multiple cells. Inset shows the false-positive and false-negative ratio of TagBiFC for mRNA labeling. e Single-molecule tracking trajectory of CFP mRNA labeled by 1×MS2-PP7 or 24×PP7. Insets show single-molecule trajectories for a high magnification. f Mean square displacement of CFP mRNA labeled by 1×MS2-PP7 or 24×PP7. Data are displayed as mean ± standard deviation. g Histogram of diffusion coefficient of CFP mRNA labeled by 1×MS2-PP7 or 24×PP7. h Schematic of plasmid used for inducible reporter mRNA expression. Two expression cascades were cloned into one plasmid to ensure the co-appearance in the same cells. The rtTA was driven by EF1a promoter while CFP-MS2-PP7 was driven by tetracycline responsible element (TRE) promoter. i Representative fluorescence images of single CFP mRNA 3D projection labeled using TagBiFC in the absence or presence of 10 μg/mL tetracycline. The mRNAs were counted using the Spots function of Imaris. Scale bar, 5 μm. j CFP mRNA copy number per cell in the absence or presence of tetracycline. ***Statistically significant difference (p value = 2.193e−06, paired t test, n = 16 for the +Dox group and n = 23 for the −Dox group).

