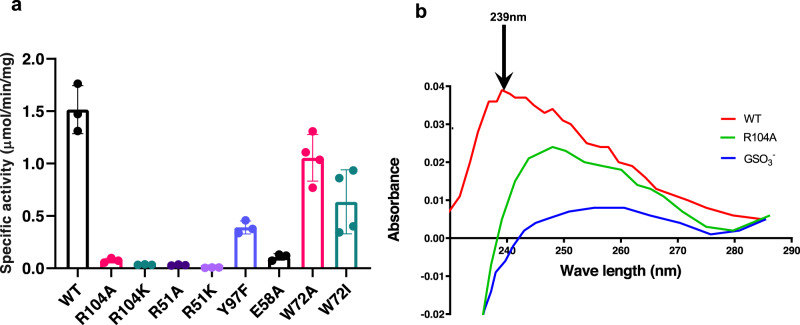
Fig. 3. Mutational analysis of MGST2.
a Wild type and mutant enzymes were assayed for LTC4 synthase activity. Error bars represent the mean values ± standard deviations of three to four independent activity measurements. b Thiolate anion formation in MGST2: UV difference spectra recorded from 230 to 285 nm demonstrate the thiolate anion peak at 239 nm, which is absent in Arg104Ala mutant and in the presence of GSO3− inhibitor. Source data are provided as a Source data file.

