
Fig. 5.
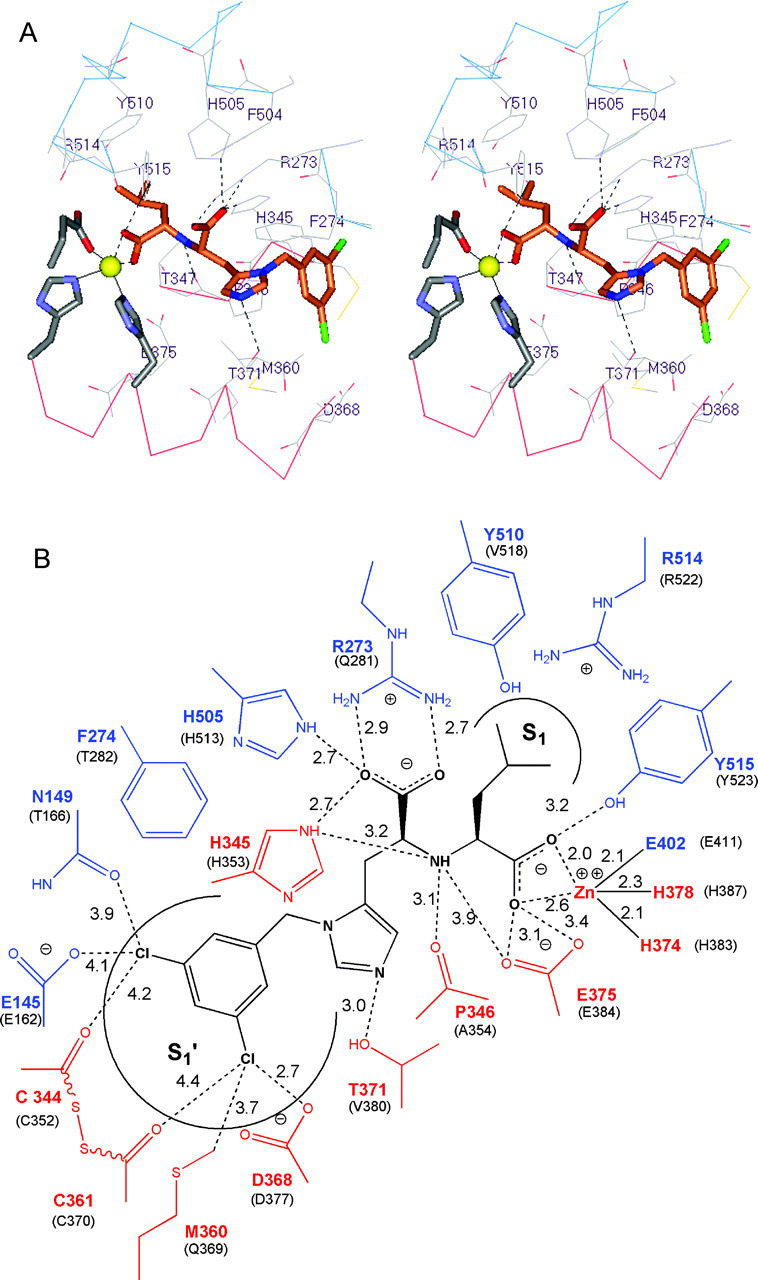
Binding interactions of the inhibitor MLN-4760 at the active site of ACE2.A, the residues of ACE2 that contribute direct binding interactions with the inhibitor MLN-4760 are shown. MLN-4760 is shown in stick rendering with the same atom color code as described in the legend to Fig. 4A, except carbon is orange. The α-helix 11 segment derived from subdomain I has the α-carbon wire colored red, and turns and β-elements derived from subdomain II have the α-carbon wire colored blue. Probable H-bonding interactions are shown as black dashed lines. The zinc ion is shown as a yellow sphere. ACE2 residues coordinating the zinc ion are shown in stick rendering. B, shown is a schematic view of MLN-4760 binding interactions. MLN-4760 is shown in black. Residues derived from subdomain I are red, and residues derived from subdomain II are blue. The equivalent residues in tACE are in given in parentheses. Distances are measured in angstroms.