
Figure 2.
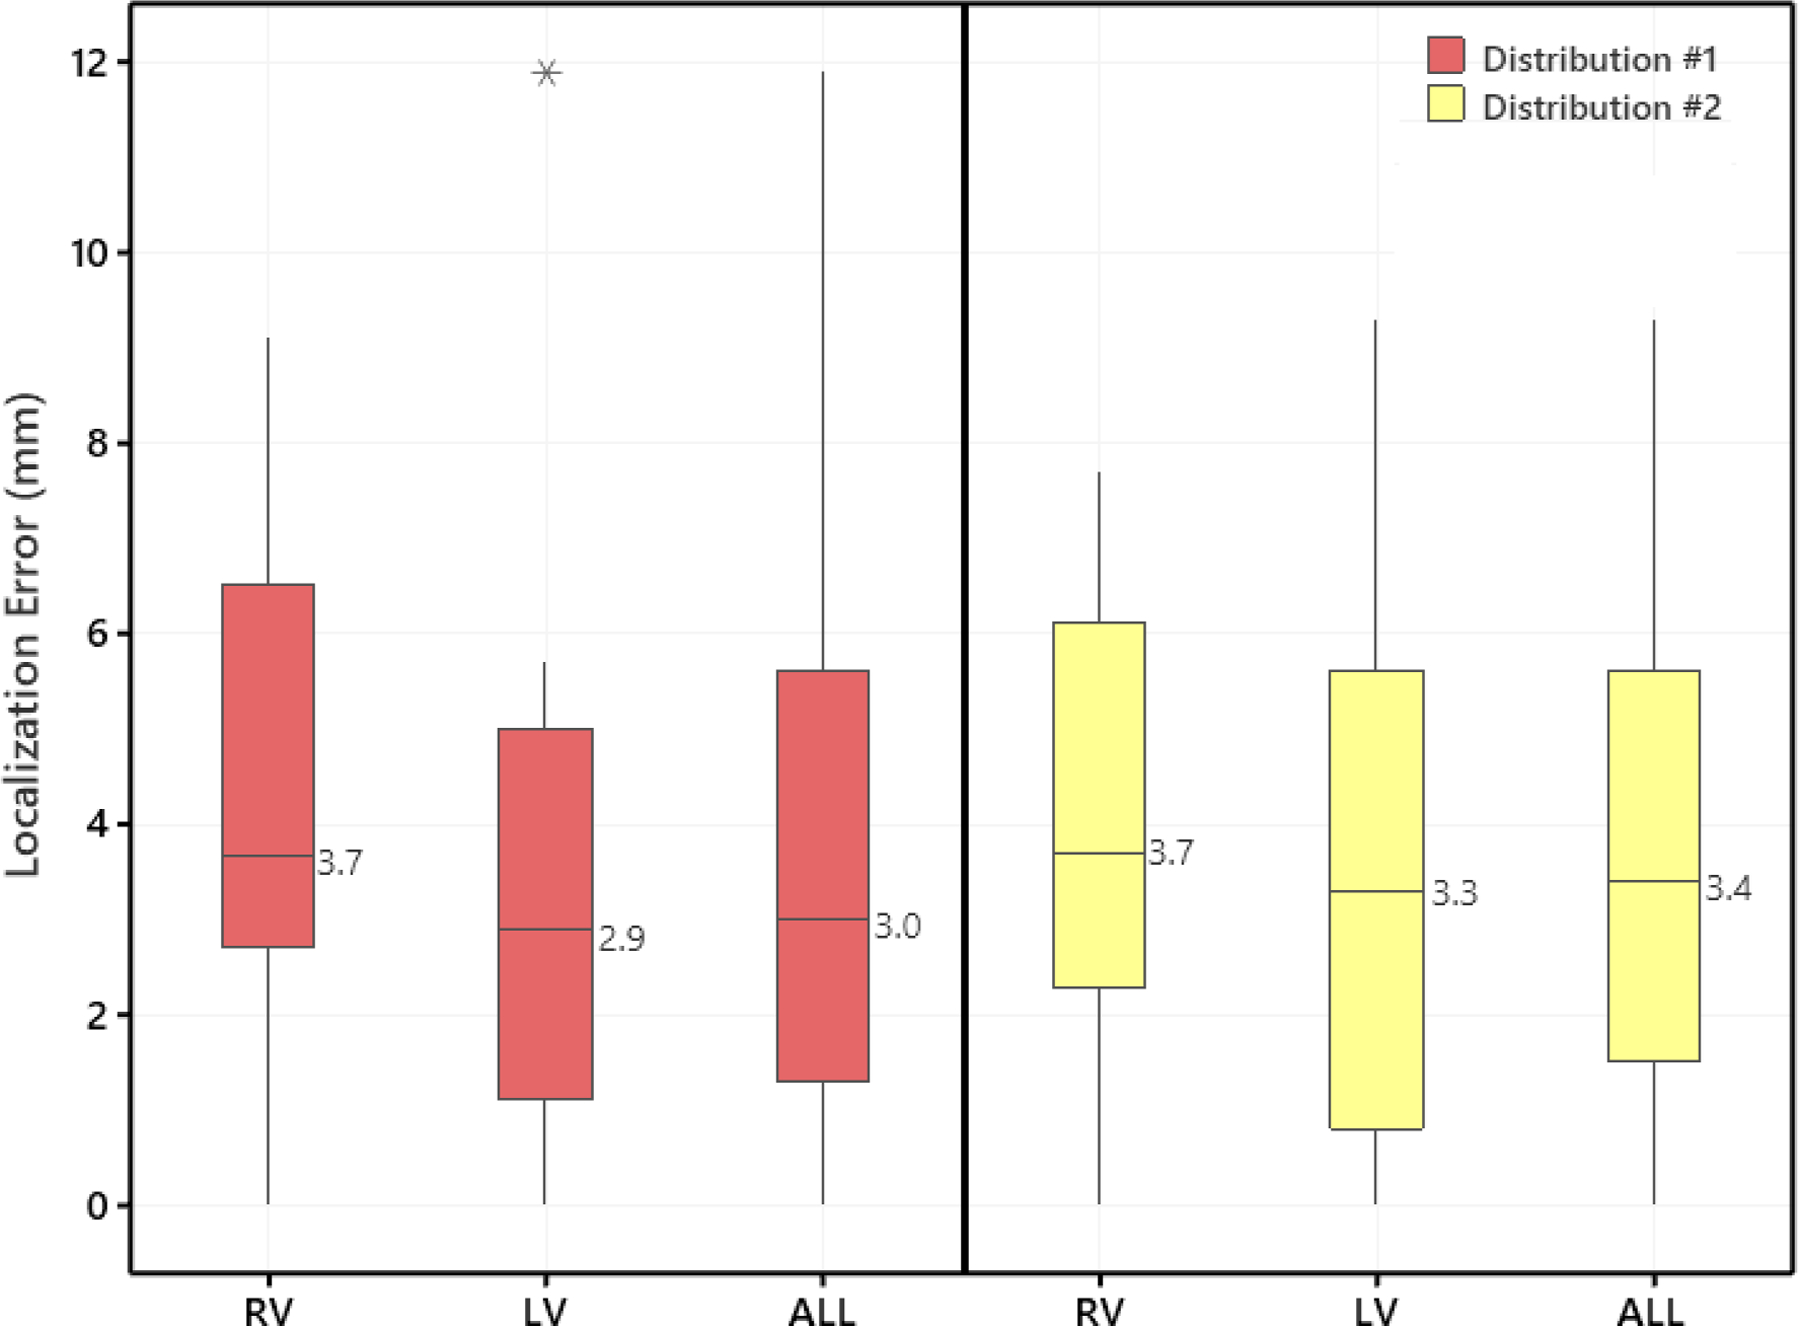
Localization errors between clinically-identified IVA origin site and the site predicted by the AAOL system using two pacing-site distributions, per cardiac chamber. Distribution #1 was to use all recorded pacing sites of a mapped IVA (in chronological order) to compute the identified PVC/VT origin site; Distribution #2 was to use 10 neighboring pacing sites of an identified IVA origin site to compute the identified PVC/VT origin site. Boxes represent interquartile range, error-bars represent range, and line in the box indicates median. The ALL plot represents the aggregate of all IVAs across all chambers. RV indicates right ventricle; and LV, left ventricle.