
Figure 3.
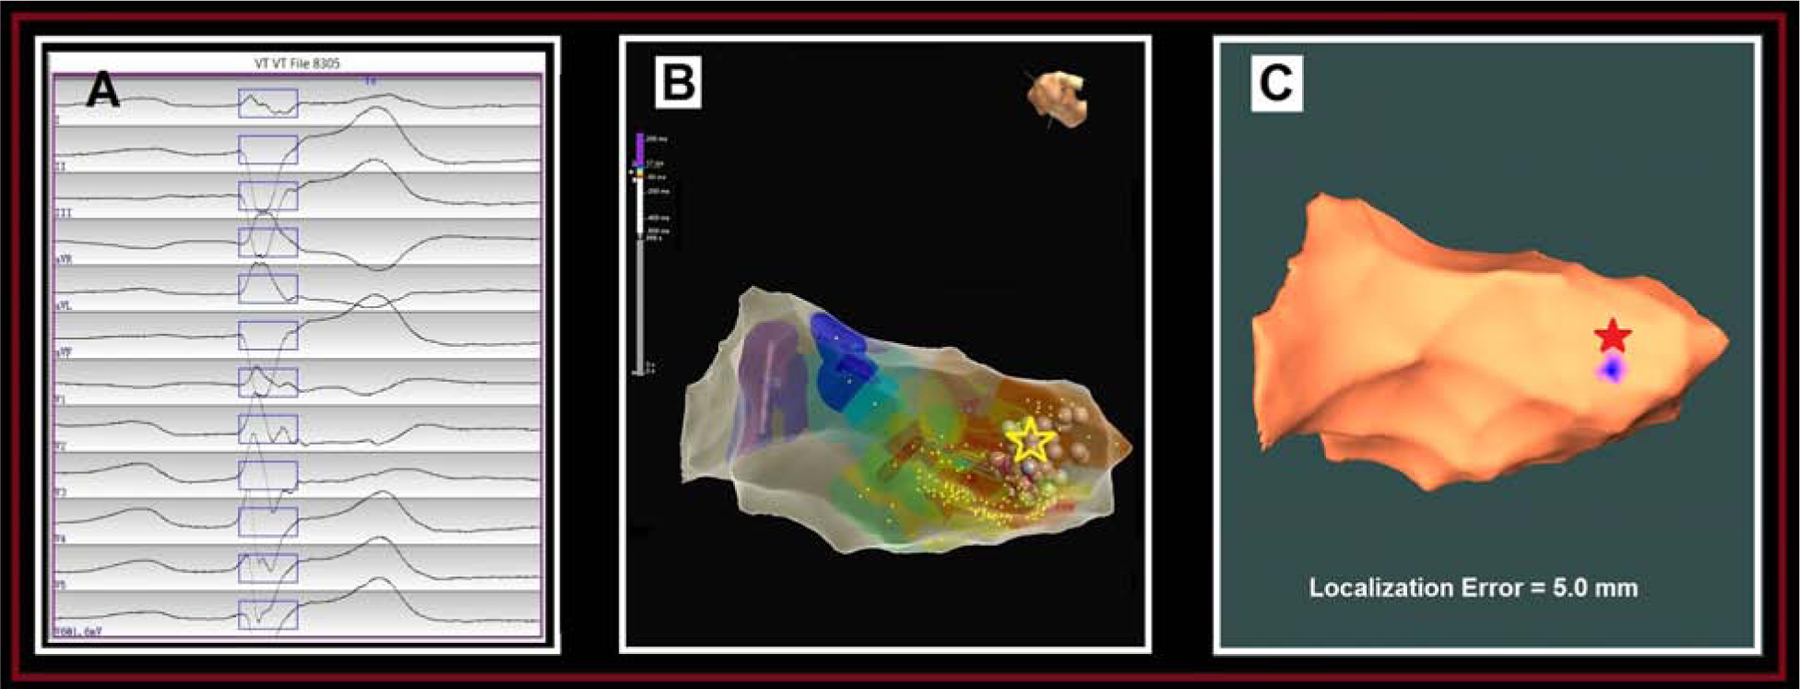
Localization of a papillary muscle PVC origin site by the AAOL system: (A) shows the recorded 12-lead ECG of PVC during the procedure for patient #6. The onset of one PVC beat was automatically detected (17); the user can edit the onset of the 120-ms window (rectangle box) if correction is necessary. (B) illustrates the endocardial local-activation-time (LAT) EAM for this patient, with the site of PVC origin site (identified by activation mapping) depicted by the yellow star. (C) shows that using the AAOL system to predict the PVC origin site indicated by the blue patch onto the EAM geometry, with the actual site of PVC origin marked by the red star. Localization error of PVC origin site is 5.0 mm.