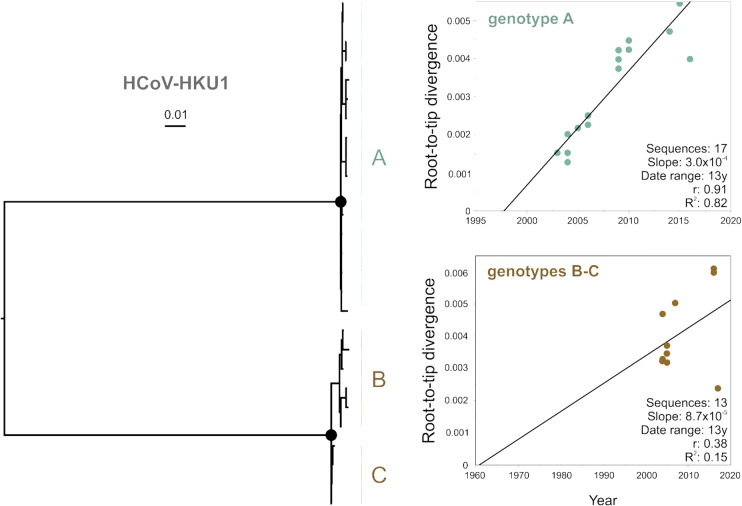
Figure 2.
Linear regression plots of root-to-tip divergence over time of major sub-lineages of HCoV-HKU1. Circles at nodes in the ML phylogeny relying on complete spike genes indicate support of ≥80 SH-alrt/≥95 UFBoot for major clades. Scale bars indicate number of nucleotide substitutions per site. Linear regression of root-to-tip genetic distances over time in years after exclusion of recombinant sequences (detailed in Table S1). The date range, slope (rate), correlation coefficient (r), and R2 are shown in the graph.

