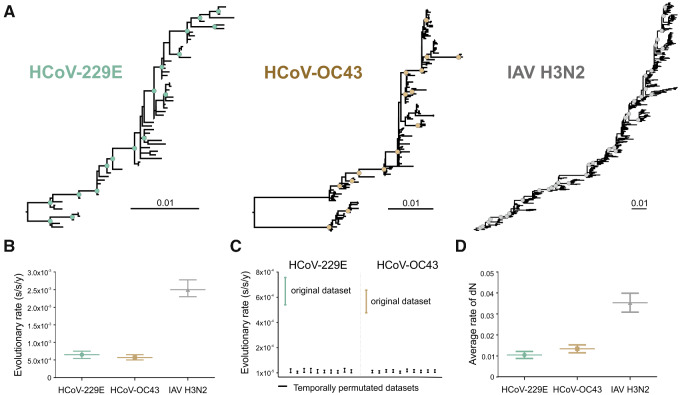
Figure 3.
Evolution of HCoV-229E , HCoV-OC43 and IAV H3N2 over time. (A) Maximum likelihood phylogenies relying on complete viral glycoprotein datasets. Circles at nodes indicate support of ≥80 SH-alrt/≥95 UFBoot for major clades. Scale bars indicate number of nucleotide substitutions per site. Sequences used are detailed in Supplementary Table S1. (B) Evolutionary rates in substitution per site per year (s/s/y) with 95 per cent HPD intervals inferred in a Bayesian framework relying on complete viral glycoprotein datasets. (C) Comparison between the 95 per cent HPD intervals of the evolutionary rates of the HCoV-229E S (teal) final dataset with date-randomized datasets (n = 10, black), and of the HCoV-OC43 S (mustard) final dataset with date-randomized datasets (n = 10, black). (D) Average rate of non-synonymous substitutions (dN ± SEM) for HCoV-229E S, HCoV-OC43 S, and IAV H3N2 HA from 2001 to 2019.

