


Figure 2. Inhibit Outcomes Over Time by Injury Group and Age.
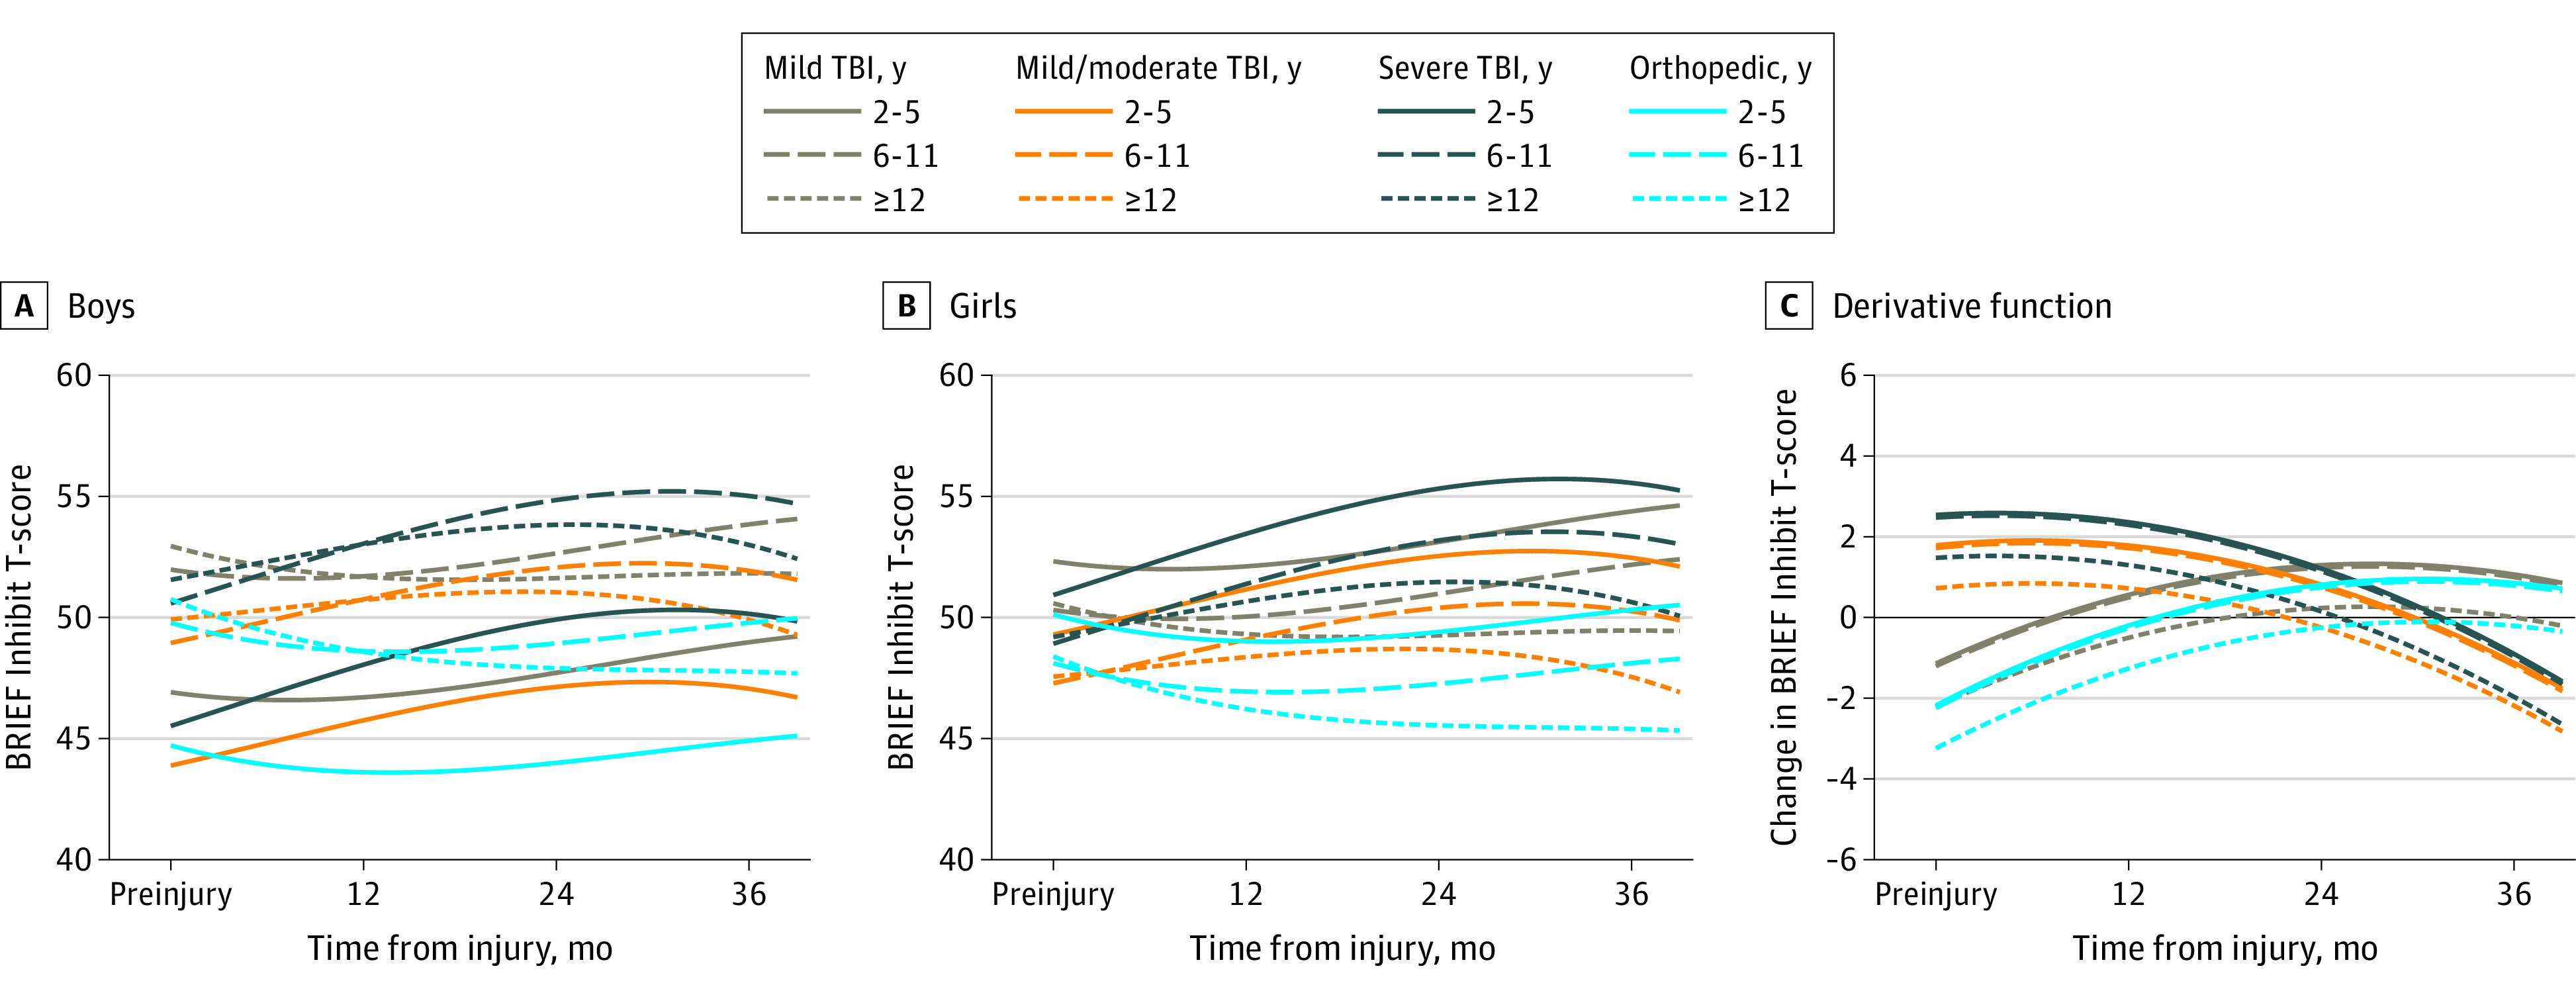
Estimated mean outcomes for (A) boys and (B) girls of English-speaking families assuming mean values of family function and social capital. Panel C shows the change in outcome over time. Values above 0 indicate that the score is increasing (worsening), whereas values below 0 indicated the score is decreasing (improving). BRIEF indicates Behavior Rating Inventory of Executive Function; TBI, traumatic brain injury.