
Figure 7.
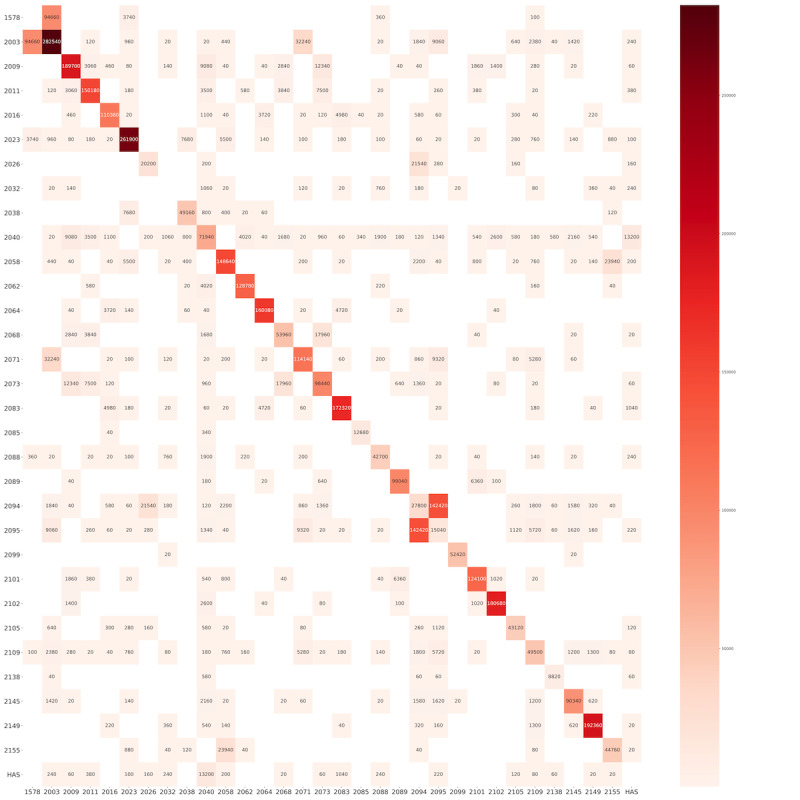
Intrahousehold and interhousehold total time in proximity (in seconds) registered by proximity sensors. The numbers on the Y axis and X axis represent the household ID. Each square represents the social contacts between the different households on the Y axis and the household on the X axis. The number in the square is the total time in proximity (in seconds). The numbers in the diagonal cells represent the total time in proximity among the members in the same household.