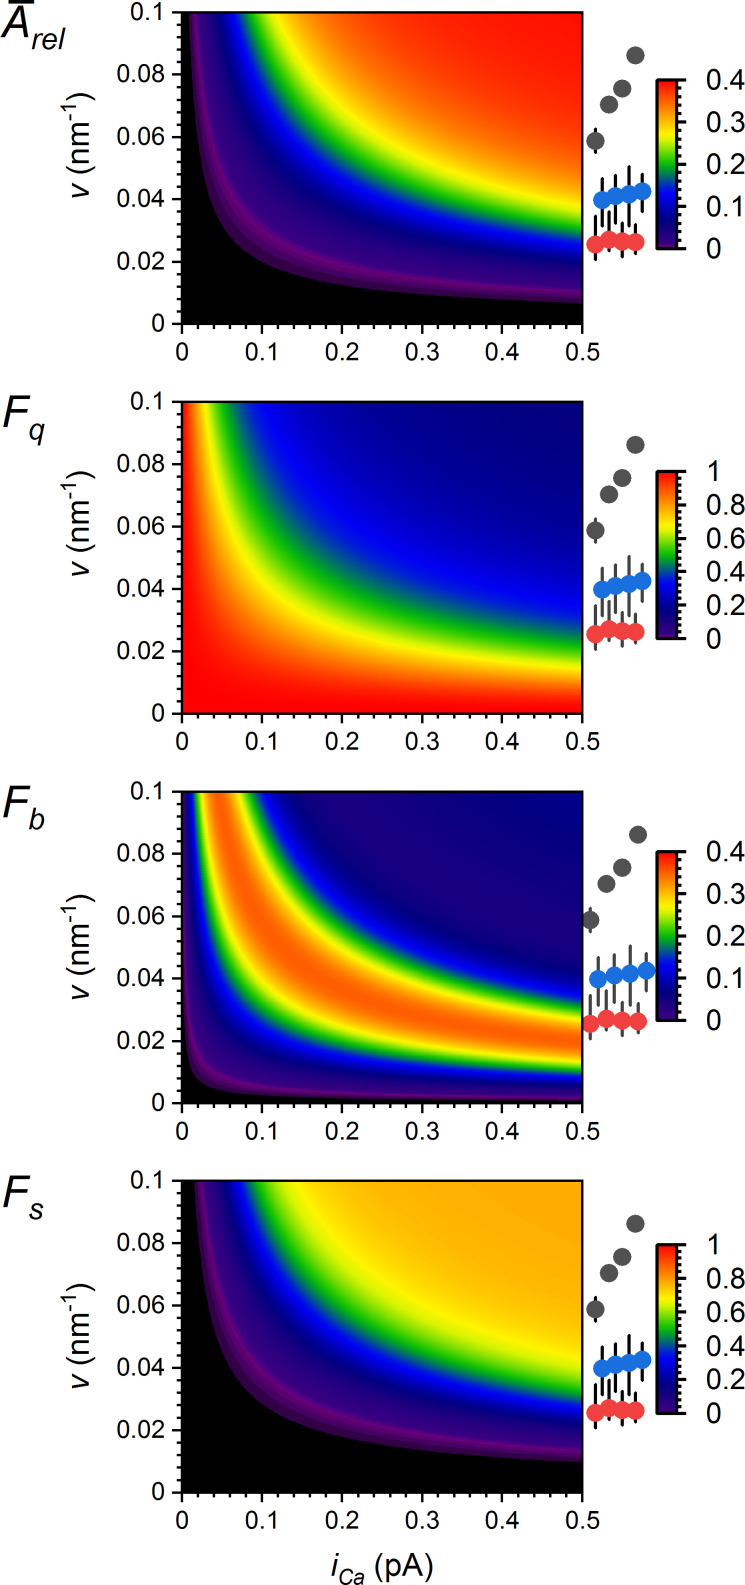
Figure 10.
Synergy graphs relating the group RYR vicinity and single-channel calcium current to CRE characteristics. The graph values, color-coded by colormaps (right), were calculated using Eqs. 8 and 9 and Table 2. The symbols on the right side of each plot indicate the group vicinities (v; mean and range) for compact (black), narrow (blue), and wide (red) CRSs, calculated for NRYR of 10, 20, 40, and 80 (from left to right, respectively). Ārel, average Arel; Fb, the fraction of blips; Fq, the fraction of quarks; Fs, the fraction of sparks.

