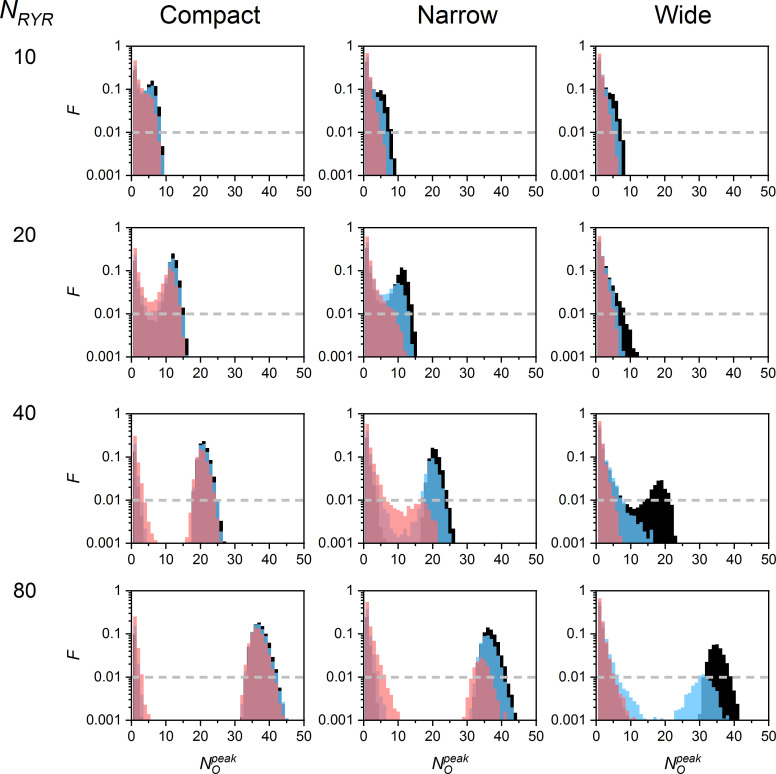
Figure 5.
values of CREs in CRSs of various density types, NRYR, and iCa. The black, blue, and red bins correspond to CREs generated by iCa of 0.4, 0.25, and 0.15 pA, respectively. The dashed lines denote the occurrence level of 1%. The exemplified data sets consisted of 10,000 simulated CREs generated for one typical CRS of each type and size. The narrow and wide CRS types were of pattern B. F, the fraction of traces.

