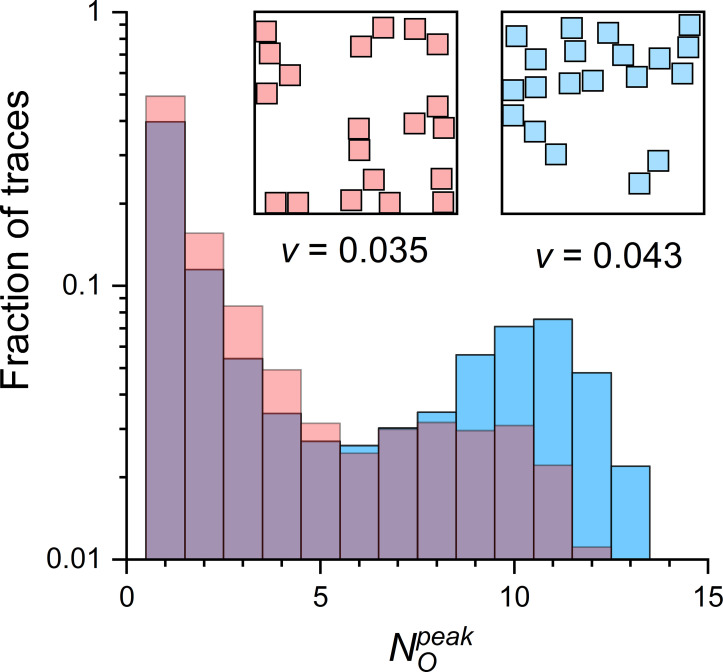
Figure 6.
distribution of two CRSs differing in RYR vicinity. The histograms were constructed from 10,000 simulated CREs per compared CRS, shown as red and blue columns. Both CRSs were of the narrow type, pattern B, 20 RYRs, and iCa = 0.25 pA. (Insets) The two CRSs were selected from the set of 100 CRSs generated for the same determinants; red RYRs had the lowest and blue RYRs had the highest RYR vicinity (v) in the CRS set.

