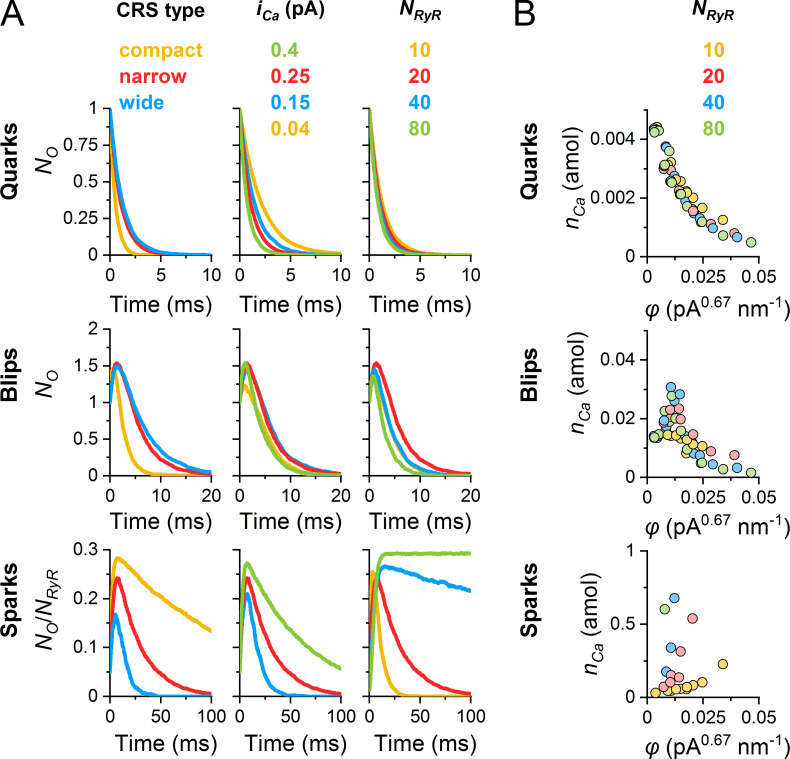
Figure 8.
Kinetics of averaged CREs in CRS models. The data were obtained from 10,000 simulated CREs generated for one typical CRS of each type and size. The narrow and wide CRS types were of pattern B. (A) The averaged time courses of quarks, blips, and sparks. Left: The range of CRS density types with NRYR = 20 and iCa = 0.25 pA. Center: Narrow CRSs with NRYR = 20 and the indicated range of iCa values. Right: Narrow CRSs with iCa of 0.25 pA and the indicated range of NRYR values. The color coding is valid for individual columns only. (B) The amount of calcium ions nCa released during average quarks, blips, and sparks plotted against the respective RYR coupling strength φ with weight factor α (nCa of sparks not terminating within the simulation time are not shown). NRyR, number of RYRs in the CRS.

