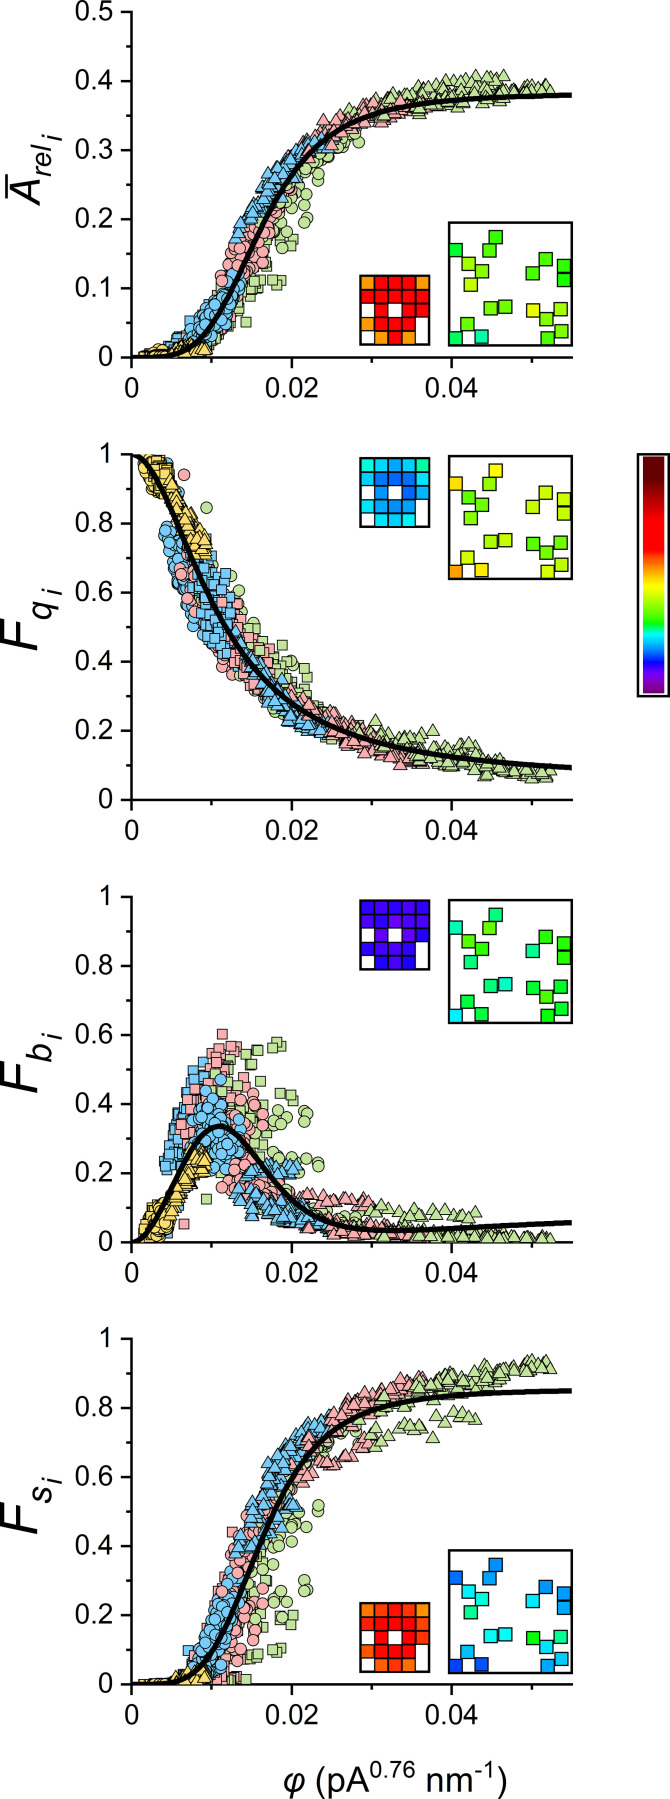
Figure 9.
Relationships between characteristics of CREs and the coupling strength φi of the initiating RYRi. The lines show the respective best global fit of all data points by functions and The best-fit parameters are given in Table 3. Indices i indicate pertinence to initiating RYR. Yellow, blue, red, and green symbols denote results for iCa values of 0.04, 0.15, 0.25, and 0.4 pA, respectively. The squares, circles, and triangles represent wide, narrow, and compact CRSs, respectively. Insets: The exemplar compact and narrow CRSs with 20 RYRs at iCa = 0.25 pA, both showing (average) response values for n = 10,000 simulations, 500 for each of the individual initiating RYRs, color-coded according to the look-up table bar (right) scaled for the range of the respective ordinates. average relative CRE amplitude; the fraction of blips; the fraction of quarks; the fraction of sparks.

