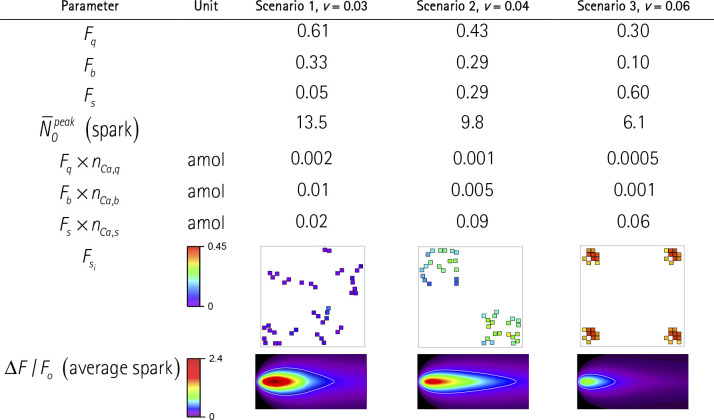
Table 6. Properties of quarks, blips, and sparks in a group of 40 RYRs assembled into one, two, or four CRSs of different RYR vicinities.
Calculated for iCa = 0.25pA. Fq, Fb, Fs are fractions of quarks, blips, and sparks per CRS, respectively. (spark) indicates the average number of RYRs open at the peak of spark. nCa,q, nCa,b, and nCa,s are the amount of calcium released per average quark, blip, and spark, respectively. the Fx × nCa,x indicate the weighted amounts of calcium released by quarks, blips, and sparks in individual scenarios. Fsi indicates the fraction of sparks per individual RYRs color-coded according to the color map. ΔF/F0 is the fluorescence of line scan images for averaged sparks (6 µm vertical × 100 ms horizontal) color coded according to the color map. The white contour lines indicate the detection limit of 0.3 ΔF/F0 units. Note that the individual CRSs are not spatially resolved.

